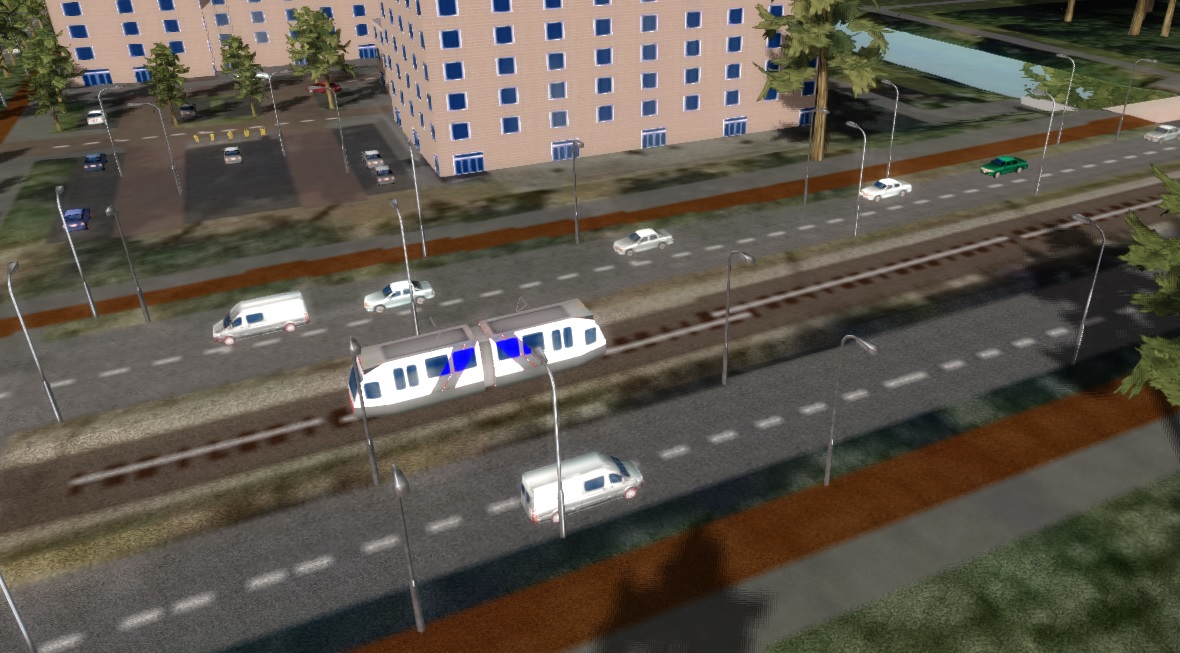
Traffic visualization

Traffic is visualized on Buildings with a Road Function Category. The visualization provides a visual indication to users about the traffic intensities in any Project. The greater the amount of traffic, the more traffic is visualized.
When referring to traffic, road-based traffic (i.e. cars, busses, etc) is often implied. However, The Tygron Platform also visualizes other traffic such as trams, trains, and ships, on the appropriate Building Functions.
The traffic visualization is based on editable attributes, which already have default values when a Project is first created. If alternative traffic data is loaded in, the visualization will adjust accordingly. If traffic data is adjusted during a session or test run, the visualization is adjusted accordingly as well.
Traffic is based on data in the Project, but is spawned in onto the relevant Buildings through an algorithm which includes randomness.
Traffic is only visualized on singular, continuous Buildings. Vehicles fade in on one end of the Building and fade out at the other end.
Configuration
- Main article: Function Values (Traffic visualization)
The main basis for traffic visualization is the Function Values present in the Project. A specific subset of Function Values dictate the traffic intensities, with 2 more dictating the speed and the amount of lanes.
Units
- Main article: Units
Visualized vehicles are Units. Depending on the specific traffic intensities configured and the Units configured in the Project, specific vehicles are visualized on roads.
Notes
- Because roads are commonly processed as smaller segments, possibly even without intersections or other objects in between, it's possible that vehicles fade in and out in the "middle" of a road, because one road Building ends there and is adjacent to another road Construction beginning there.
- The visualized traffic is multiplied by a factor which is part of the Settings of a Project, which can be edited as part of the properties of a Traffic Density Overlay. It's possible to (temporarily) add a Traffic Density Overlay, change the setting, and then remove the Traffic Density Overlay if it is otherwise not or no longer required.
- The traffic visualization multiplier has no effect on calculation models such as the Traffic Overlays.
