Demo Aerius Project: Difference between revisions
(Created page with "__NOTOC__ {|class="wikitable" style="margin: auto; background-color:#ffffcc;" | Next page>> |} File:Watershed.PNG|thumb|right|300px|...") |
No edit summary |
||
| (45 intermediate revisions by 5 users not shown) | |||
| Line 1: | Line 1: | ||
__NOTOC__ | __NOTOC__ | ||
{| | {{Unavailable|type=demo Project}} | ||
[[File:Demo_aerius_project.PNG|thumb|right|300px|The Demo Aerius project]] | |||
This project | The Demo Aerius project is available for all users and can be found in the main menu under Edit projects. This project does not count towards your license. | ||
The ''Demo | Take a look at this project when working with topics such as '''building plans, spatial development, environmental regulations, building policies'''. | ||
This project showcases '''the [[Aerius Module]]'''. | |||
The ''Demo Aerius'' project demonstrates the [[Aerius Overlay]] in a project of the Hague. It can serve as a working demo to explore the [[Aerius Module]] and the configurable parameters. | |||
By following the steps below, a new Office building will be constructed. Parameters such as the amount of office space, the liters fuel used by the construction machines and the increase of traffic will be entered and send to the Aerius Calculator. The Aerius Calculator will calculate the effect on the nitrogen deposition on Natura 2000 areas. <br> | |||
<br> | |||
In this project, a custom Excel panel (in Dutch) is created to enter the parameters for the new Office building. This panel can be downloaded and configured to your liking (this is not part of this tutorial). The increase of traffic can also be automatically calculated in an Excel panel. (also not part of this tutorial). | |||
==Exploring the project== | ==Exploring the project== | ||
==== | ====Creating a scenario==== | ||
# Click on the '' | ''In the following steps we will import a plan and its characteristics in a Tygron [[project]]'' | ||
# Click on the tab ''Future Design'' and click in the Action bar on the house icon (see image below). | |||
# | # In the new panel that opens, select the Office measure and click on the ''Apply'' button. The new office building is constructed. Click on the Confirm button and close the panel by clicking on the close icon. | ||
# Notice the arrow above the new Office. Click on the arrow to open another panel. If the arrow is not visible, try zooming out and in with your scroll wheel mouse button to update the view. | |||
# | # Click on the ''[[Plan_category_amounts_(Aerius_Overlay)|Plan]]'' button and enter 5000 m2 for the [[Plan_category_amounts_(Aerius_Overlay)#Plan_categories|Office and Shops category]]. Then click on the ''Bouw'' button. | ||
# Choose in the drop-down menu the ''Stage V, >=255 cc, bouwjaar 2019 (4-takt)'' [[Machine_category_index_(Aerius_Overlay)#Construction machine categories|construction machine category]] and a [[Machine_fuel_usage_(Aerius_Overlay)|fuel usage]] of 2000 liter per year. Then click on ''Verstuur''. The panel closes and the geometry of the office building and values are sent to the Aerius Calculator to calculate the nitrogen deposition. | |||
# Click on the road icon to open a new panel. Then click on the roads where you think [[Traffic_attributes_(Aerius_Overlay)|traffic will increase]] by constructing this new office building. The selected roads will be highlighted green. When you are done, click on upgrade. | |||
# In the new panel that opens, enter the increase of [[Light_traffic_num_(Aerius_Overlay)|light]], [[Medium_traffic_num_(Aerius_Overlay)|medium]] and [[Heavy_traffic_num_(Aerius_Overlay)|heavy traffic]] (see image below). Then click on ''Upgrade''. The road geometries and new traffic intensities will be sent to the Aerius Calculator. <br> | |||
<gallery mode=nolines> | <gallery mode=nolines> | ||
File: | File:Future design house.PNG|Step 1. Click in the Future design tab on the house icon. | ||
File: | File:Apply office.PNG|Step 2. Click on the Office measure and Apply. | ||
File: | File:Confirm.PNG|Step 2. Click on Confirm and close the panel. | ||
File: | File:Icon building.PNG|Step 3. Click on the blue arrow. | ||
File: | File:Office space panel.PNG|Step 4. Fill in the amount of office space in m2. | ||
File:Fuel usage bouw.PNG|Step 5. Choose a construction machine category and fill in the fuel usage per year. Click on ''Verstuur''. | |||
File:Designate_roads.PNG|Step 6. Click on the car icon and select the roads where traffic will increase. Then click on Upgrade. | |||
File:Upgrade_roads.PNG|Step 7. Enter the increase in traffic for the different traffic sectors and click on Upgrade. | |||
</gallery> | </gallery> | ||
====Results==== | ====Results==== | ||
# | ''In the following steps we will assess the impact of the imported plan'' | ||
# Click on the [[Aerius Overlay]] in the Overlay bar and zoom out to see the whole map. The hexagons where there is nitrogen deposition on Natura 2000 areas are visible. | |||
# Click on a hexagon to see the nitrogen deposition in mol/hectare/year. | |||
# Then click on the Light traffic overlay in the Overlay bar to see the map where light traffic increases. Inspect also the medium and heavy traffic overlays. | |||
# | # Click on the City Overlay (house icon) to go back to the normal [[3D Visualization]].To see the [[Aerius_module_overview#Output|emissions]] of NOx and NH3 in kg/year for the various sources, click on the ''Current Situation'' tab and then on the button ''Buildings''. Select the new Office building. On the right select the tab ''Attributes'' to see all the attributes of the building. Notice the [[Nox_(Aerius_Overlay)|NOx]] and [[Nh3_(Aerius_Overlay)|NH3]] attributes. | ||
# Select then one of the roads which you have selected as a road where traffic would increase. Go to the ''Attributes'' tab and notice the emission attributes. | |||
<gallery mode=nolines> | <gallery mode=nolines> | ||
File: | File:Result_office_plan.PNG|Step 1. Click on the Aerius Overlay in the Overlay bar. | ||
File: | File:More_info_aerius.PNG| Step 2. Click on one of the hexagons to see the quantity. | ||
File:Traffic_increase.PNG|Step 3. Inspect the traffic overlays by hovering over the Aerius overlay and clicking on one of the icons. | |||
File: | File:Emissons_building.PNG| Step 4. Click in the Current tab on the Buildings and inspect the NOx and NH3 attributes of the building. | ||
File: | File:Emissions_road.PNG| Step 5. Inspect the NOx and NH3 attributes of one of the roads where the traffic increases. | ||
File: | |||
</gallery> | </gallery> | ||
=== | ====Changing a scenario==== | ||
'' | ''In the following steps we will change a few parameters of the plan to see if this improves the results or makes them even worse.'' | ||
# Click on the tab ''Future Design''. | |||
# Click on the blue arrow to go back to the plan properties panel. Click on the Plan button and change the area size of 5000 m2 for office and shops to 2500 and enter for the number of appartments: 100. Then click on ''Verstuur''. The new scenario is send and calculated by the Aerius Calculator. | |||
# Click again on the Aerius overlay and see that there is still nitrogen deposition on Natura 2000 areas. Click on the same hexagon as before and notice that the quantity has decreased. | |||
# Click | |||
# | |||
''' | |||
# | |||
<gallery mode=nolines> | <gallery mode=nolines> | ||
File: | File:Change_scenario.PNG|Step 1. Click on the blue arrow and change the plan properties. Click on ''Verstuur''. | ||
File: | File:Result_scenario.PNG|See the results of the changed scenario in the Aerius Overlay. | ||
</gallery> | </gallery> | ||
{| | {{article end | ||
| [[ | |notes= | ||
|} | |seealso= | ||
* [[List of Demo Projects]] | |||
|howtos= | |||
{{ | * [[How to add a dynamic traffic model]] | ||
|videos= | |||
{{video|lang=dutch|link=https://youtu.be/2ib4KZ_ji6k|description=The connection between Aerius and the {{software}}.}} | |||
}} | |||
[[Category:Demo projects]] | |||
{{Aerius Module buttons}} | |||
Latest revision as of 14:19, 30 January 2023

The Demo Aerius project is available for all users and can be found in the main menu under Edit projects. This project does not count towards your license.
Take a look at this project when working with topics such as building plans, spatial development, environmental regulations, building policies.
This project showcases the Aerius Module.
The Demo Aerius project demonstrates the Aerius Overlay in a project of the Hague. It can serve as a working demo to explore the Aerius Module and the configurable parameters.
By following the steps below, a new Office building will be constructed. Parameters such as the amount of office space, the liters fuel used by the construction machines and the increase of traffic will be entered and send to the Aerius Calculator. The Aerius Calculator will calculate the effect on the nitrogen deposition on Natura 2000 areas.
In this project, a custom Excel panel (in Dutch) is created to enter the parameters for the new Office building. This panel can be downloaded and configured to your liking (this is not part of this tutorial). The increase of traffic can also be automatically calculated in an Excel panel. (also not part of this tutorial).
Exploring the project
Creating a scenario
In the following steps we will import a plan and its characteristics in a Tygron project
- Click on the tab Future Design and click in the Action bar on the house icon (see image below).
- In the new panel that opens, select the Office measure and click on the Apply button. The new office building is constructed. Click on the Confirm button and close the panel by clicking on the close icon.
- Notice the arrow above the new Office. Click on the arrow to open another panel. If the arrow is not visible, try zooming out and in with your scroll wheel mouse button to update the view.
- Click on the Plan button and enter 5000 m2 for the Office and Shops category. Then click on the Bouw button.
- Choose in the drop-down menu the Stage V, >=255 cc, bouwjaar 2019 (4-takt) construction machine category and a fuel usage of 2000 liter per year. Then click on Verstuur. The panel closes and the geometry of the office building and values are sent to the Aerius Calculator to calculate the nitrogen deposition.
- Click on the road icon to open a new panel. Then click on the roads where you think traffic will increase by constructing this new office building. The selected roads will be highlighted green. When you are done, click on upgrade.
- In the new panel that opens, enter the increase of light, medium and heavy traffic (see image below). Then click on Upgrade. The road geometries and new traffic intensities will be sent to the Aerius Calculator.
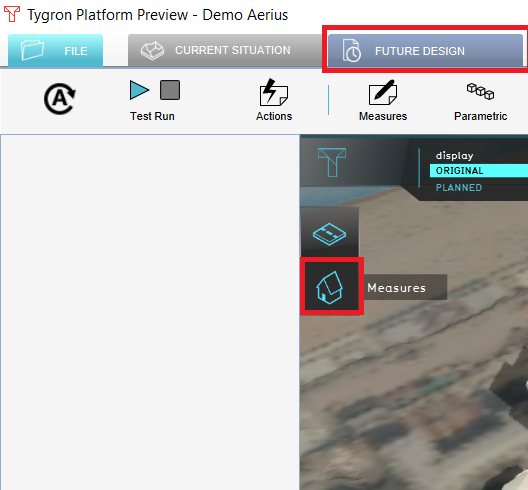
Step 1. Click in the Future design tab on the house icon.
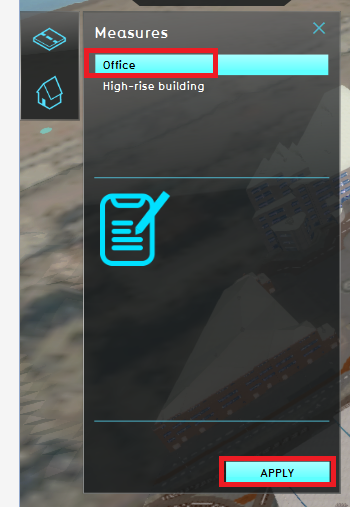
Step 2. Click on the Office measure and Apply.
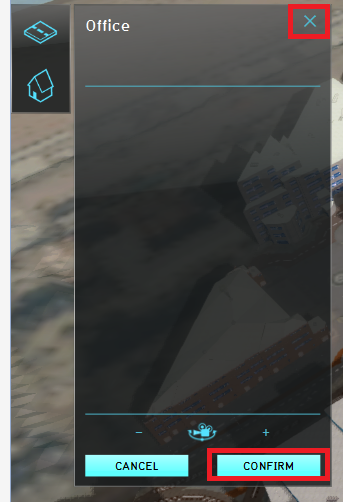
Step 2. Click on Confirm and close the panel.
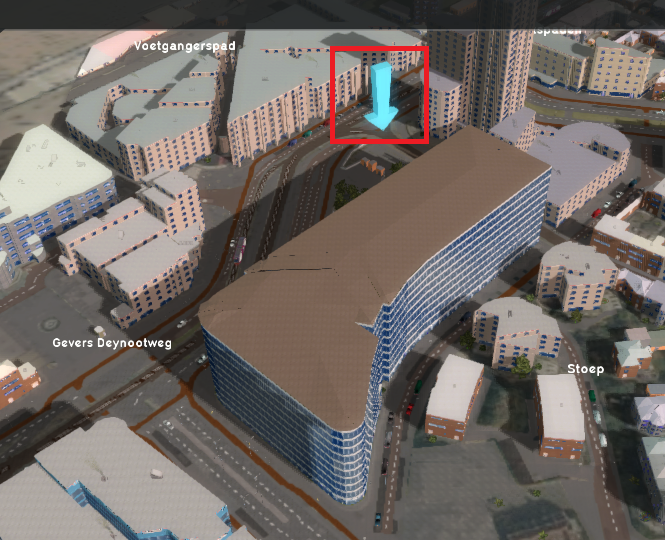
Step 3. Click on the blue arrow.
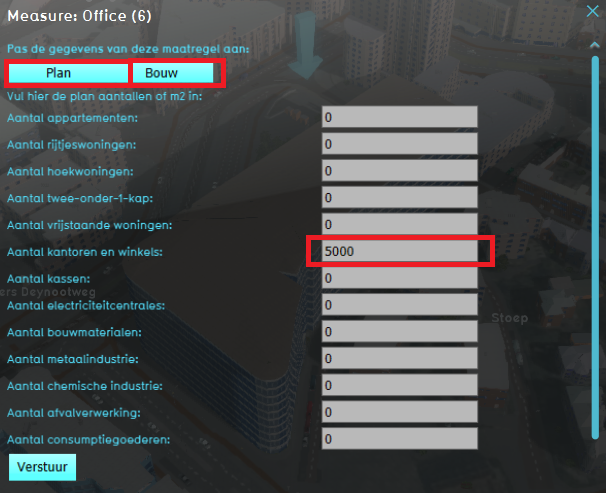
Step 4. Fill in the amount of office space in m2.
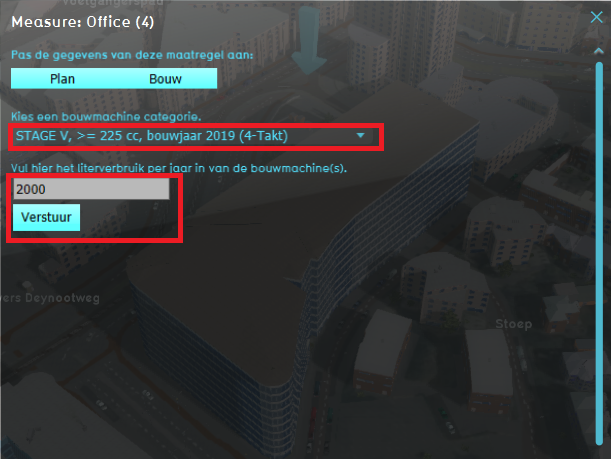
Step 5. Choose a construction machine category and fill in the fuel usage per year. Click on Verstuur.
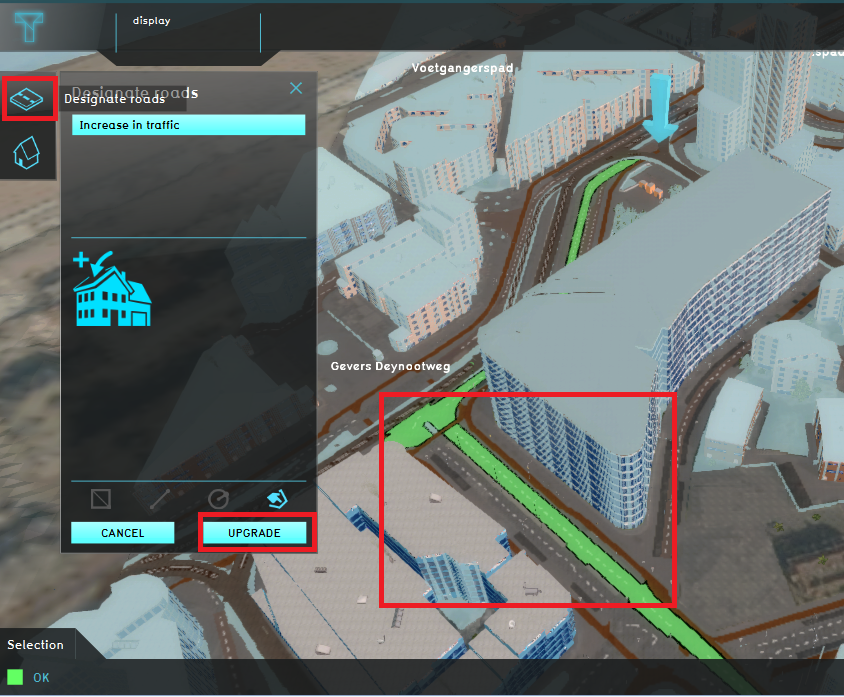
Step 6. Click on the car icon and select the roads where traffic will increase. Then click on Upgrade.
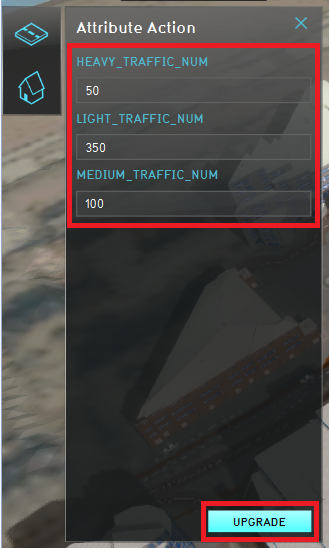
Step 7. Enter the increase in traffic for the different traffic sectors and click on Upgrade.


Results
In the following steps we will assess the impact of the imported plan
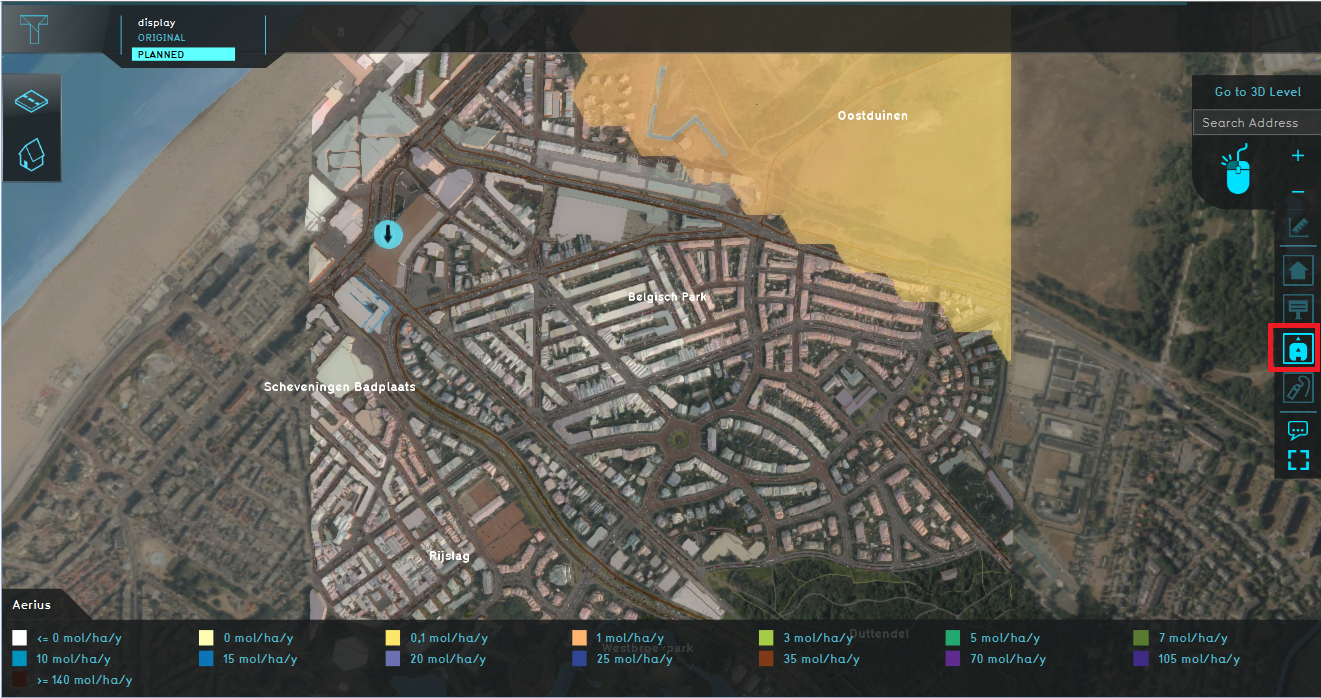
- Click on the Aerius Overlay in the Overlay bar and zoom out to see the whole map. The hexagons where there is nitrogen deposition on Natura 2000 areas are visible.
- Click on a hexagon to see the nitrogen deposition in mol/hectare/year.
- Then click on the Light traffic overlay in the Overlay bar to see the map where light traffic increases. Inspect also the medium and heavy traffic overlays.
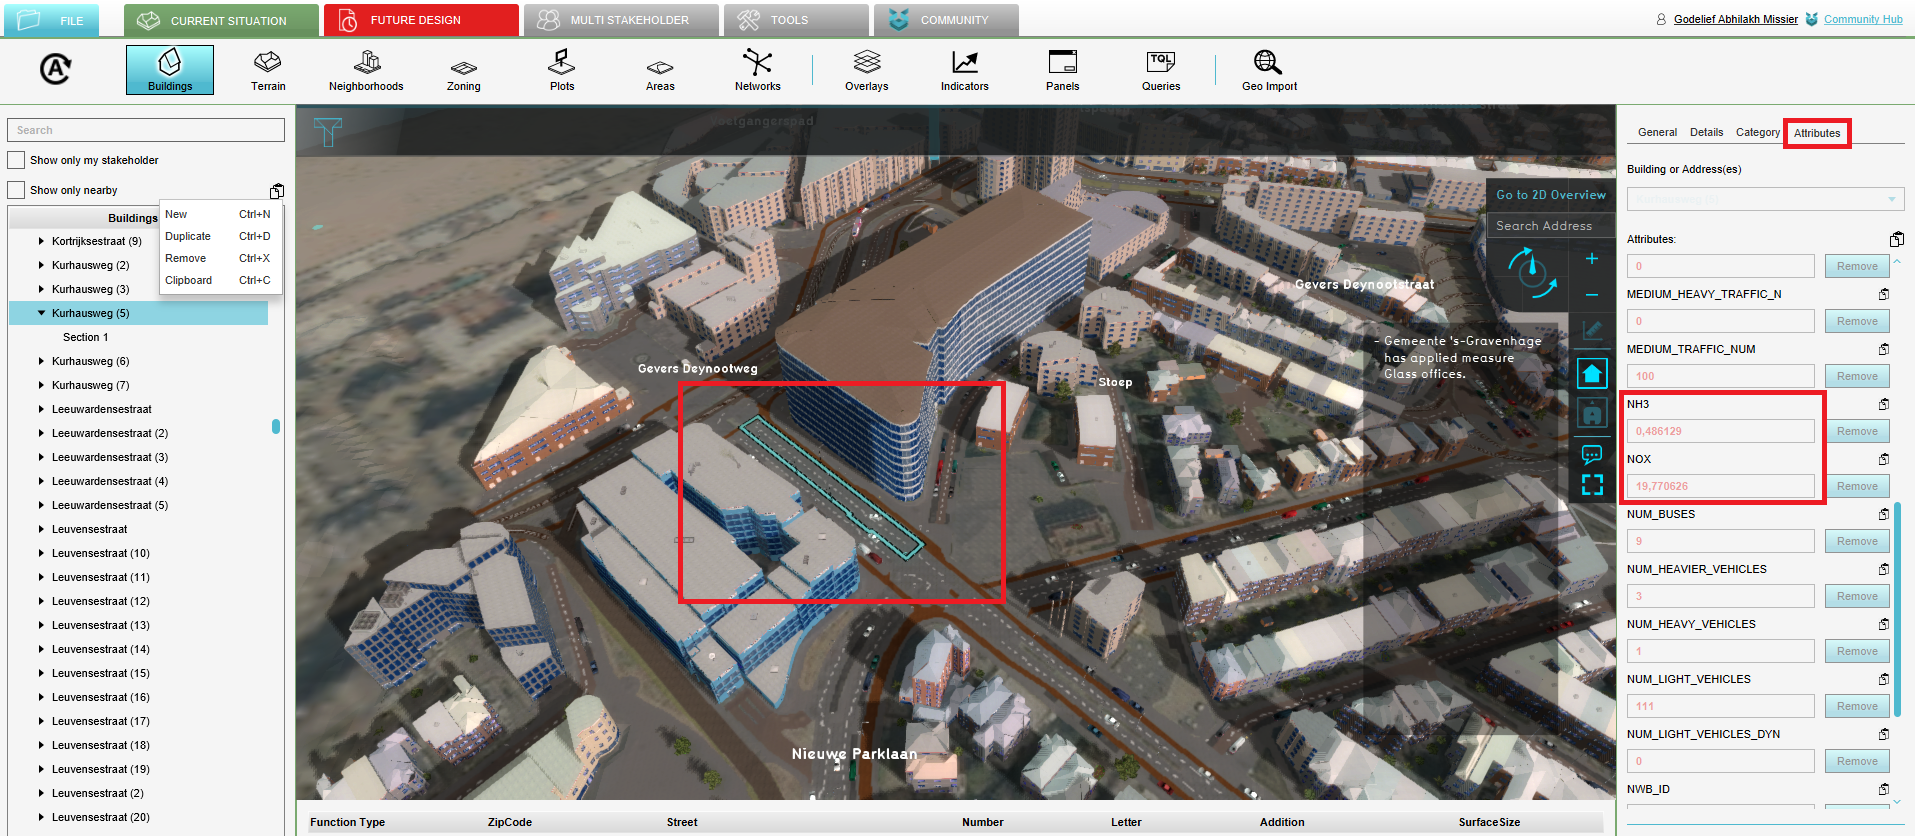
- Click on the City Overlay (house icon) to go back to the normal 3D Visualization.To see the emissions of NOx and NH3 in kg/year for the various sources, click on the Current Situation tab and then on the button Buildings. Select the new Office building. On the right select the tab Attributes to see all the attributes of the building. Notice the NOx and NH3 attributes.
- Select then one of the roads which you have selected as a road where traffic would increase. Go to the Attributes tab and notice the emission attributes.
Step 1. Click on the Aerius Overlay in the Overlay bar.
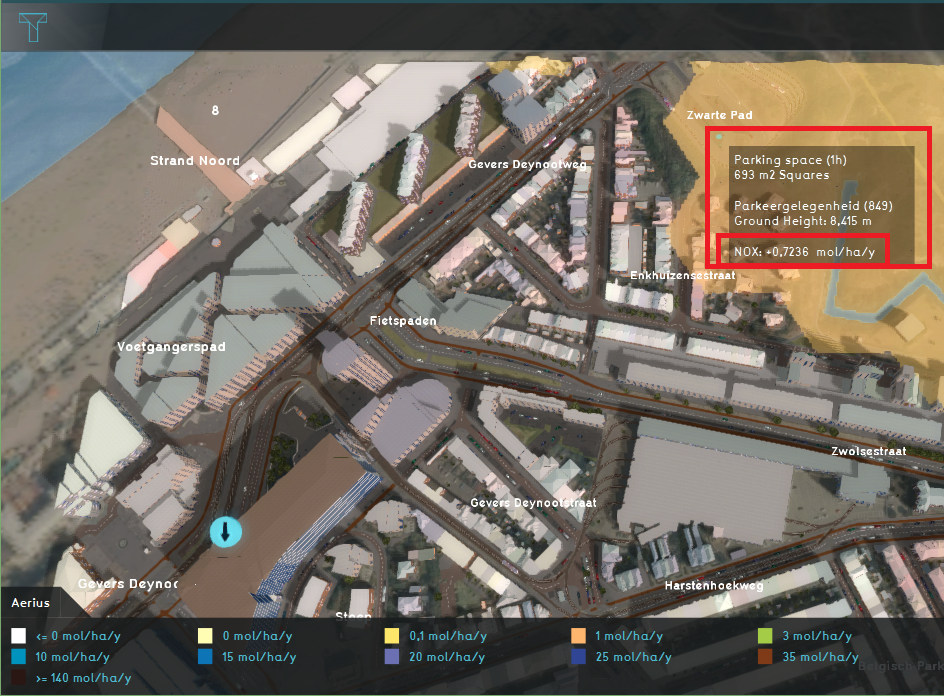
Step 2. Click on one of the hexagons to see the quantity.
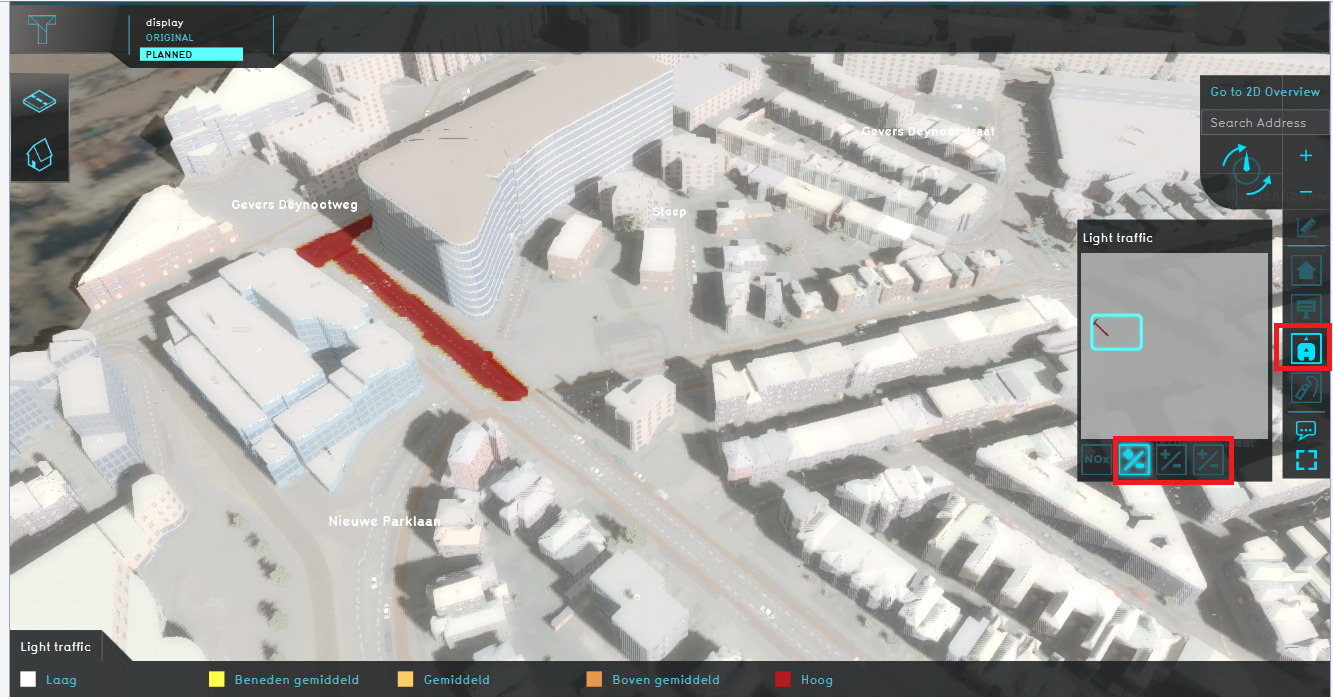
Step 3. Inspect the traffic overlays by hovering over the Aerius overlay and clicking on one of the icons.
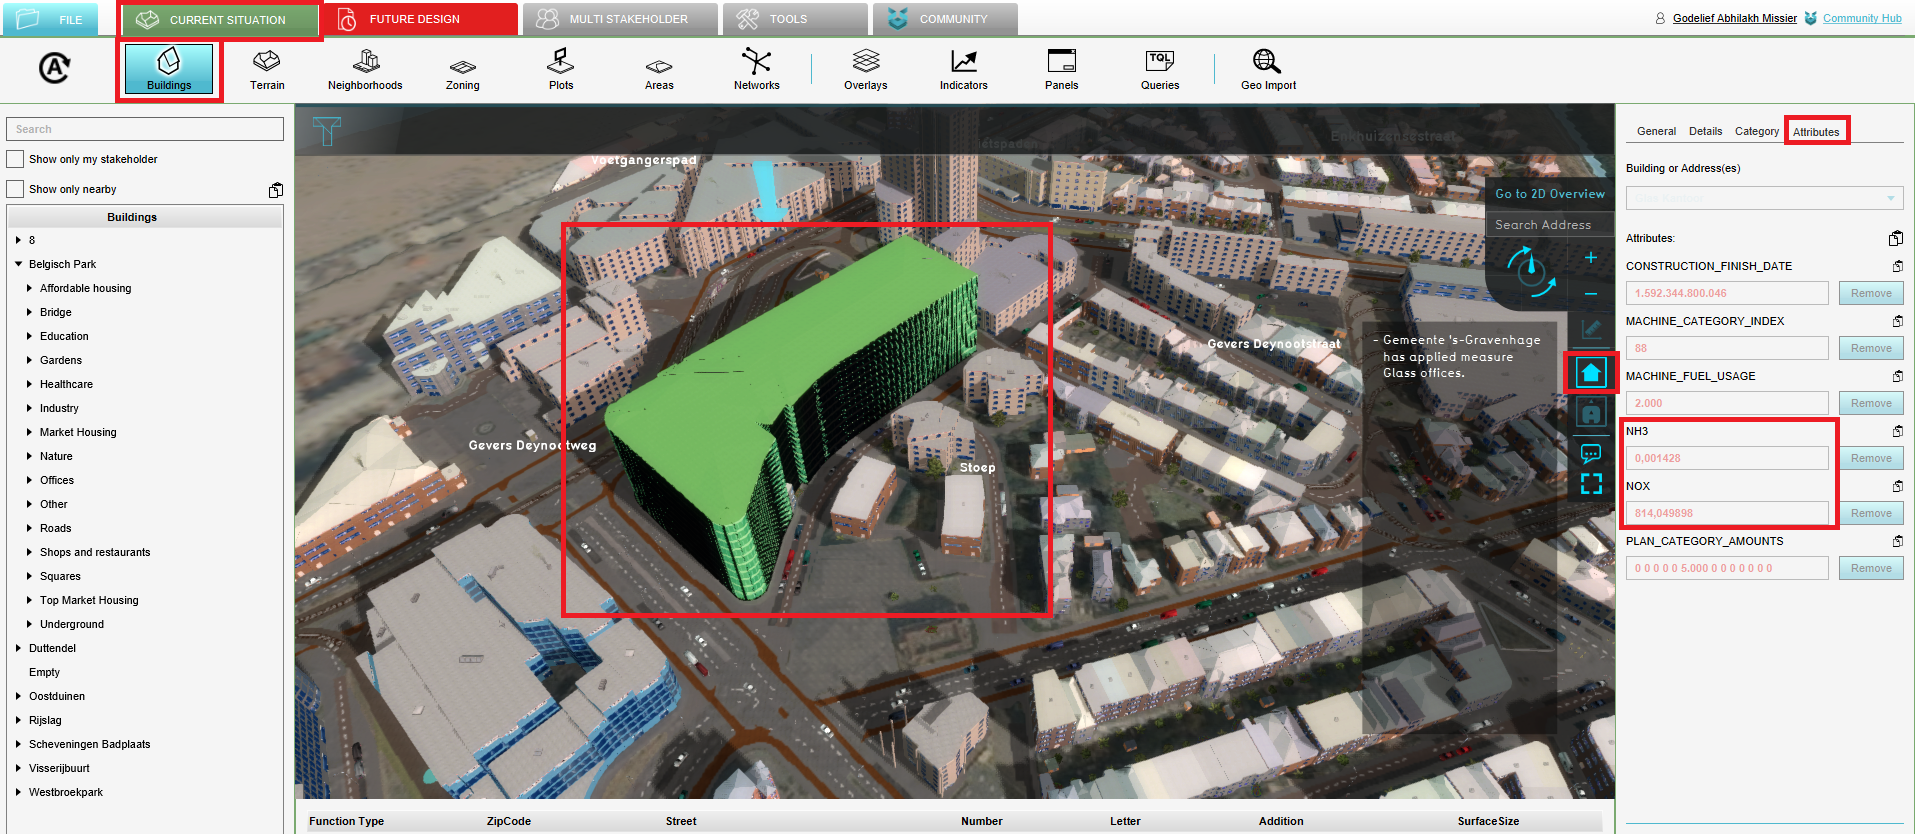
Step 4. Click in the Current tab on the Buildings and inspect the NOx and NH3 attributes of the building.
Step 5. Inspect the NOx and NH3 attributes of one of the roads where the traffic increases.


Changing a scenario
In the following steps we will change a few parameters of the plan to see if this improves the results or makes them even worse.
- Click on the tab Future Design.
- Click on the blue arrow to go back to the plan properties panel. Click on the Plan button and change the area size of 5000 m2 for office and shops to 2500 and enter for the number of appartments: 100. Then click on Verstuur. The new scenario is send and calculated by the Aerius Calculator.
- Click again on the Aerius overlay and see that there is still nitrogen deposition on Natura 2000 areas. Click on the same hexagon as before and notice that the quantity has decreased.
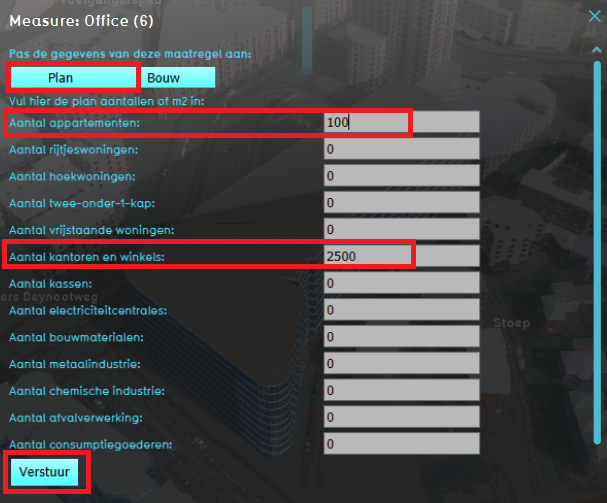
Step 1. Click on the blue arrow and change the plan properties. Click on Verstuur.
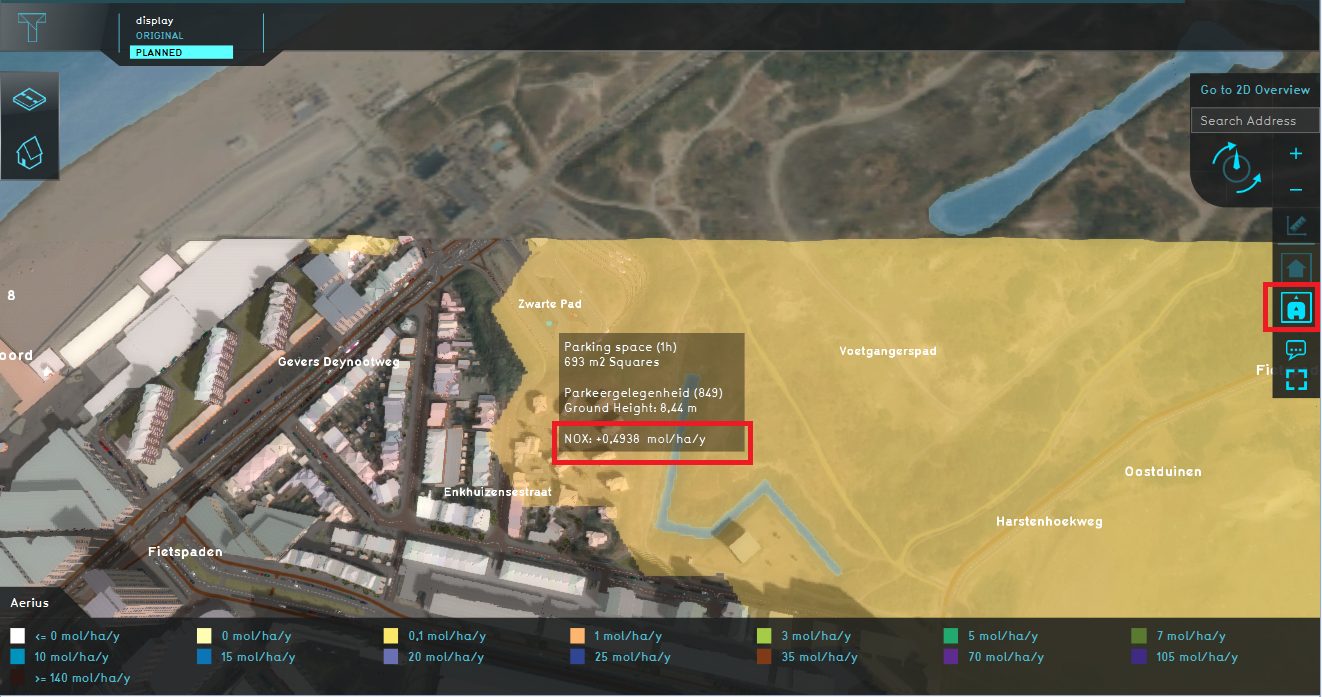
See the results of the changed scenario in the Aerius Overlay.


How-to's
Videos
See also


