Subsidence Overlay overview: Difference between revisions
No edit summary |
|||
| (34 intermediate revisions by 2 users not shown) | |||
| Line 1: | Line 1: | ||
The [[Subsidence Overlay]] calculates subsidence by calculating oxidation and compaction in an iterative process to simulate the progression over a configurable number of years. | |||
===Calculation model steps=== | |||
To calculate subsidence, the parameters are initialized based on data available in the [[Project]]. | |||
{{gallery | |||
| mode=traditional | |||
| width=250px | |||
| subsidence_step1.png | The groundwater situation is determined based on an initial groundwater input, and changes to surface water policy. | |||
| subsidence_step2.png | Terrain properties are determined through present [[Terrain Type]]s, and otherwise based on defaults. | |||
}} | |||
Next, a number of steps are repeated to simulate the yearly subsidence, and to update the intermediately changing parameters for the calculation accordingly. These steps are repeated n times, where n is the amount of [[Years (Subsidence Overlay)|years]] configured. | |||
{{gallery | |||
| width=250px | |||
| mode=traditional | |||
| subsidence_step8.png | A calculation cycle is repeated for each year the simulation is set to compute. | |||
| subsidence_step3.png | 3: Oxidation is dependent on configured [[Parameter a recalculation formula (Subsidence Overlay)|climate model]], [[High ground water level prequel (Subsidence Overlay)|high-]] and [[Low ground water level prequel (Subsidence Overlay)|low ground water levels]], [[Peat fraction (Subsidence Overlay)|peat fraction]] and [[Clay thickness prequel (Subsidence Overlay)|clay thickness]]. | |||
| subsidence_step4.png | 4: Compaction is dependent on added soil, settling into itself and pre-existing terrain. | |||
}}<br> | |||
{{gallery | |||
| width=250px | |||
| mode=traditional | |||
| subsidence_step5.png | 5: Subsidence is computed per cell, based on oxidation and compaction. | |||
| subsidence_step6.png | 6: Water levels are [[indexation (Subsidence Overlay)|indexed]] (if configured as such), meaning they are adjusted to compensate for subsidence so their height relative to the surface remains the same, or less depending on the indexation percentage. | |||
| subsidence_step7.png | 7: Ground water levels are recalculated based on the adjusted water levels and the lowered surface. | |||
}} | |||
{{clear}} | |||
===Overlay Results=== | |||
The overlay offers the following result types: | The overlay offers the following result types: | ||
{| | |||
{{result types|suppresscategory=true|allowselflinks=true| | |||
{{:Subsidence result type (Subsidence Overlay)}} | |||
{{:Oxidation result type (Subsidence Overlay)}} | |||
{{:Settlement result type (Subsidence Overlay)}} | |||
{{:Hi ground water result type (Subsidence Overlay)}} | |||
{{:Low ground water result type (Subsidence Overlay)}} | |||
}} | |||
===Legend=== | ===Legend=== | ||
| Line 38: | Line 50: | ||
==Output== | ==Output== | ||
The output of all result types of the overlay is in meters. The results can be [[Grid overlay#Export as | The output of all result types of the overlay is in meters. The results can be [[Grid overlay#Export as GeoTIFF|exported as GeoTIFF]]. | ||
===Timeframes=== | |||
The amount of timeframes generated for the subsidence overlay are determined by [[Years (Subsidence Overlay)]] divided by [[Years per timeframe (Subsidence Overlay)]] | |||
===Subsidence output=== | ===Subsidence output=== | ||
| Line 46: | Line 60: | ||
* The amount of subsidence taking place over the configured amount of years. | * The amount of subsidence taking place over the configured amount of years. | ||
* The current surface water level, and to what level it will have changed after the subsidence has taken place. | * The current surface water level, and to what level it will have changed after the subsidence has taken place. | ||
* The [[subsidence calculation#Indexation|indexation]] policy currently configured for this water | * The [[subsidence calculation#Indexation|indexation]] policy currently configured for this water area. | ||
===Groundwater level output=== | ===Groundwater level output=== | ||
| Line 55: | Line 69: | ||
===Final water level=== | ===Final water level=== | ||
The overlay can also write the final surface water level | The overlay can also write the final [[Water level output (Subsidence Overlay)|surface water level]] to the [[Water area (Subsidence Overlay)|water area]]. | ||
{{ | {{SubsidenceOverlay_nav}} | ||
Latest revision as of 14:19, 23 February 2023
The Subsidence Overlay calculates subsidence by calculating oxidation and compaction in an iterative process to simulate the progression over a configurable number of years.
Calculation model steps
To calculate subsidence, the parameters are initialized based on data available in the Project.
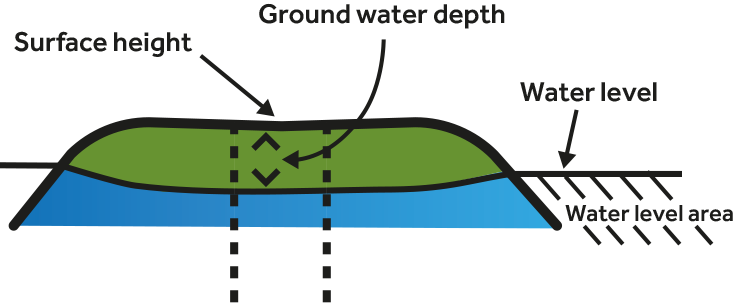
The groundwater situation is determined based on an initial groundwater input, and changes to surface water policy.
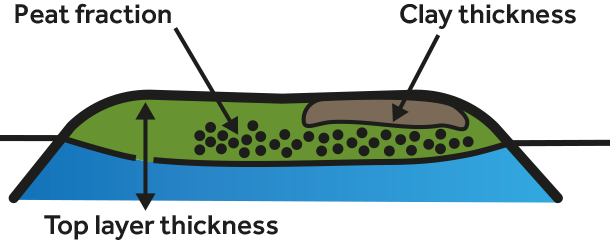
Terrain properties are determined through present Terrain Types, and otherwise based on defaults.


Next, a number of steps are repeated to simulate the yearly subsidence, and to update the intermediately changing parameters for the calculation accordingly. These steps are repeated n times, where n is the amount of years configured.
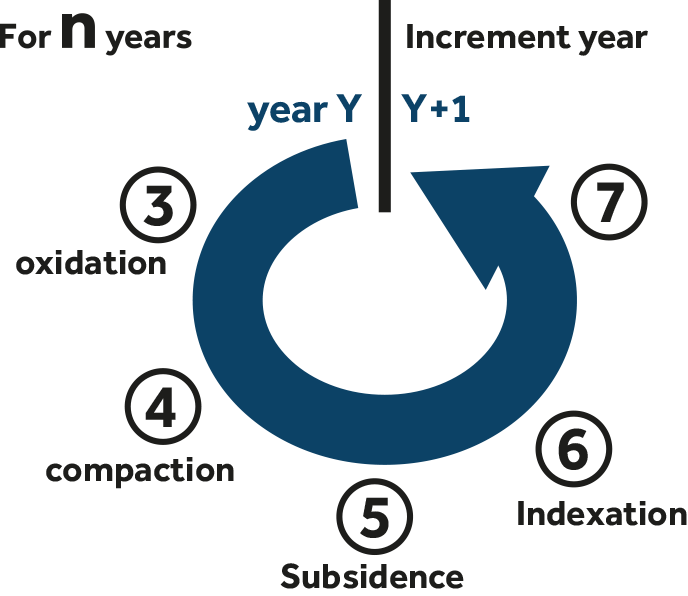
A calculation cycle is repeated for each year the simulation is set to compute.
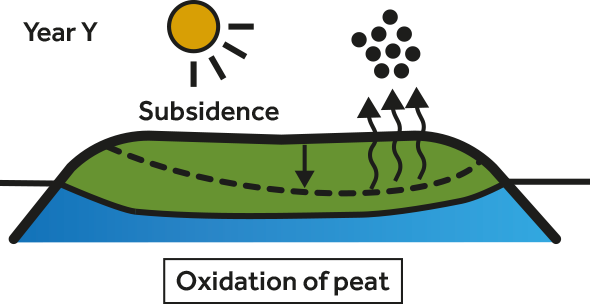
3: Oxidation is dependent on configured climate model, high- and low ground water levels, peat fraction and clay thickness.
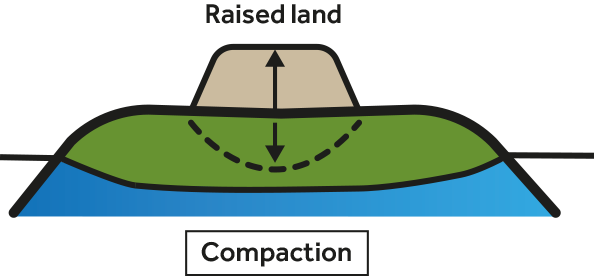
4: Compaction is dependent on added soil, settling into itself and pre-existing terrain.


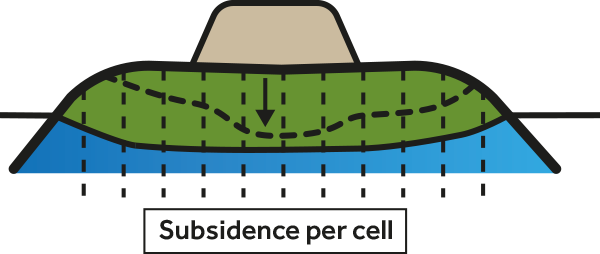
5: Subsidence is computed per cell, based on oxidation and compaction.
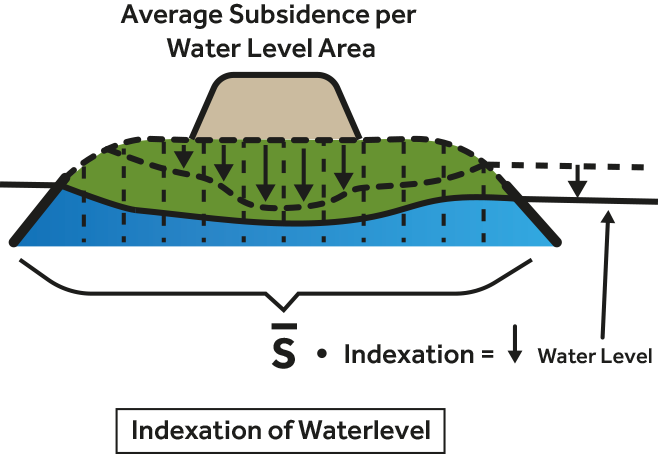
6: Water levels are indexed (if configured as such), meaning they are adjusted to compensate for subsidence so their height relative to the surface remains the same, or less depending on the indexation percentage.
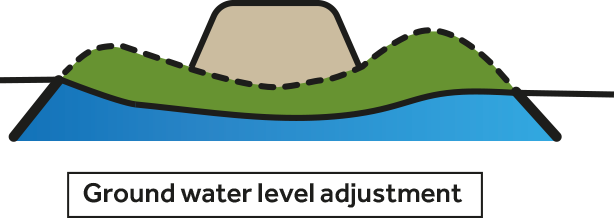
7: Ground water levels are recalculated based on the adjusted water levels and the lowered surface.


Overlay Results
The overlay offers the following result types:
| Icon | Result type | Unit | Mode | Description |
|---|---|---|---|---|
| |
SUBSIDENCE | m | Total | The amount that the ground has lowered as a result of subsidence, both oxidation and compaction. |
| |
OXIDATION | m | Total | The amount that the ground has lowered as a result of peat oxidation. |
| |
SETTLEMENT | m | Total | The amount that the ground has lowered as a result of compaction. |
| |
HI_GROUND_WATER | m | Total | The distance between the ground surface and the highest ground water level. |
| |
LOW_GROUND_WATER | m | Total | The distance between the ground surface and the lowest ground water level. |
Legend
The legend of the subsidence overlays is automatically calculated, based on the amount of years being calculated by the overlay. The colors will remain constant based on average subsidence per year. I.e. if the amount of years is doubled, the values in the legend, corresponding to specific colors, are doubled as well. Because the legend displays total amounts of subsidence rather than averages, the displayed range of amounts changes when the amount of calculation years changes.
The legend of the groundwater overlays is constant, and will display a color from blue through yellow to red to indicate how wet the soil is. The closer the groundwater is to the surface of the land, the bluer the overlay. In contrast to the subsidence legends, the range of values for groundwater do not change.

Subsidence legend for 30 years
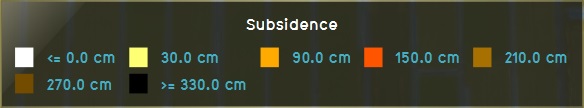
Subsidence legend for 60 years
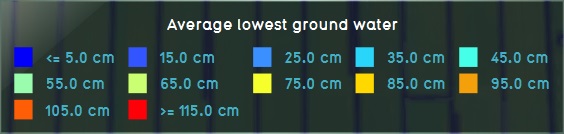
Groundwater legend


Output
The output of all result types of the overlay is in meters. The results can be exported as GeoTIFF.
Timeframes
The amount of timeframes generated for the subsidence overlay are determined by Years (Subsidence Overlay) divided by Years per timeframe (Subsidence Overlay)
Subsidence output
The output of the grid of each subsidence result type is the subsidence in meters. Depending on the exact result type used, the output is the amount of subsidence as the result of one specific calculation, or the sum of all the calculations of subsidence.
The hover panel will display the following information:
- The amount of subsidence taking place over the configured amount of years.
- The current surface water level, and to what level it will have changed after the subsidence has taken place.
- The indexation policy currently configured for this water area.
Groundwater level output
The output of the grid of each groundwater result type is the final distance from the groundwater level to the surface of the land in meters.
The hover panel will display the following information:
- The level to which the groundwater will have changed, after the subsidence has taken place.
Final water level
The overlay can also write the final surface water level to the water area.


- Group
- Model
- Parameter a recalculation • Ground water depth • Oxidation • Compaction • Subsidence • Indexation
- Related