Demo 3-30-300 Project: Difference between revisions
No edit summary |
|||
| (17 intermediate revisions by 2 users not shown) | |||
| Line 1: | Line 1: | ||
{{demo project summary | {{demo project summary | ||
| title=Demo 3-30-300 | | title=Demo 3-30-300 | ||
| image=demo-3-30-300.jpg | | image=demo-3-30-300.jpg | ||
| demographic=people who are working in fields such as climate adaptation, livability, policies regarding green environments, and urban planning | | demographic=people who are working in fields such as climate adaptation, livability, policies regarding green environments, and urban planning | ||
| showcases= | | showcases=a method for calculating the 3-30-300 policy guidelines in the {{software}} | ||
| description=The demo is a working project in which a number of generally available [[Grid Overlay]]s in the {{software}} are combined to perform specific policy-dictated calculations. Following the 3-30-300 guidelines as closely as possible, these methods calculate | | description=The demo is a working project in which a number of generally available [[Grid Overlay]]s in the {{software}} are combined to perform specific policy-dictated calculations. Following the 3-30-300 guidelines as closely as possible, these methods calculate sight-lines onto trees, foliage coverage, and distance to significant usable green spaces. | ||
}} | }} | ||
| Line 17: | Line 15: | ||
Each rule is codified in an [[Overlay]], with a number of sub [[Overlay]]s. The sub Overlays each form a step in the total calculation, and are in the order that the steps in the calculation are taken. By first inspecting the parent [[Overlay]], the net result can be seen. Then, by inspecting the sub Overlays in order, the calculations can be progressively made clear. | Each rule is codified in an [[Overlay]], with a number of sub [[Overlay]]s. The sub Overlays each form a step in the total calculation, and are in the order that the steps in the calculation are taken. By first inspecting the parent [[Overlay]], the net result can be seen. Then, by inspecting the sub Overlays in order, the calculations can be progressively made clear. | ||
Some calculations are performed separately and are explained | Some calculations are performed separately and are explained separately. This is because the calculations are complex and warrant the ability to understand what is happening separate from the greater calculation, or because the calculations are reused between rules. The results of these separate calculations are separate Overlays, with their own sub Overlays for their own calculations. | ||
{{clear}} | {{clear}} | ||
===Rule-3=== | ===Rule-3=== | ||
[[File:Demo-3-30-300-rule3.jpg|thumb|right|300px|Estimations of walls of residences, and whether they can see a tree or not.]] | [[File:Demo-3-30-300-rule3.jpg|thumb|right|300px|Estimations of walls of residences, and whether they can see a tree or not.]] | ||
Rule 3 dictates that, from any residence, at least 3 trees should be visible. Although explicitly counting the amount of trees is currently not possible, it ís possible to draw | {{main|How to compute residential walls with sight of trees}} | ||
Rule 3 dictates that, from any residence, at least 3 trees should be visible. Although explicitly counting the amount of trees is currently not possible, it ís possible to draw sight-lines from trees, detect outside walls of residences, and combine the two to find the walls which do or do not have sight on a tree. | |||
The Overlay "'''Rule-3 (Sight on tree)'''" | The Overlay "'''Rule-3 (Sight on tree)'''" demonstrates the results of calculation to test for this rule. The child Overlay is a sub calculation which works towards the final result. | ||
The calculation also relies on 2 maps which are calculated | The calculation also relies on 2 maps which are calculated separately. | ||
* A map of {{inlink|Residences}} is created. | * A map of {{inlink|Residences}} is created. | ||
* A map of {{inlink|Walls of residences}} is created. | * A map of {{inlink|Residence walls|Walls of residences}} is created. | ||
* An additional [[Attribute]] is attached to [[Function]]s of trees, indicating the distance at which they can be seen. | * An additional [[Attribute]] is attached to [[Function]]s of trees, indicating the distance at which they can be seen. | ||
* A [[Distance | * A [[Sight Distance Overlay]] is used to draw sight-lines to trees, by referring to that [[Attribute]]. | ||
* A [[Combo Overlay]] combines {{inlink|Walls of residences}} and [[Distance | * A [[Combo Overlay]] combines {{inlink|Walls of residences}} and [[Sight Distance Overlay|tree sight-lines]], to display which walls can or cannot see a tree. | ||
{{clear}} | {{clear}} | ||
===Rule-30=== | ===Rule-30=== | ||
[[File:Demo-3-30-300-rule30.jpg|thumb|right|300px|Estimations of public space, and whether there is foliage coverage there.]] | [[File:Demo-3-30-300-rule30.jpg|thumb|right|300px|Estimations of public space, and whether there is foliage coverage there.]] | ||
{{main|How to compute the presence of foliage in public spaces}} | |||
Rule 30 dictates that 30% of the public space must feature foliage. The {{software}} offers some options for estimating the presence of foliage. The definition of public space can be manually defined with a few simple rules. | Rule 30 dictates that 30% of the public space must feature foliage. The {{software}} offers some options for estimating the presence of foliage. The definition of public space can be manually defined with a few simple rules. | ||
The Overlay "'''Rule-30 (Foliage coverage)'''" | The Overlay "'''Rule-30 (Foliage coverage)'''" demonstrates the results of calculation to test for this rule. The child Overlay is a sub calculation which works towards the final result. | ||
The calculation also relies on a map which is calculated | The calculation also relies on a map which is calculated separately. | ||
* A map of {{inlink|Public space}} is created. | * A map of {{inlink|Public space}} is created. | ||
| Line 52: | Line 52: | ||
===Rule-300=== | ===Rule-300=== | ||
[[File:Demo-3-30-300-rule300.jpg|thumb|right|300px|Locations of residences, and whether they are within 300m of large usable green space.]] | [[File:Demo-3-30-300-rule300.jpg|thumb|right|300px|Locations of residences, and whether they are within 300m of large usable green space.]] | ||
{{main|How to compute residences within walking distance of significant usable public green}} | |||
Rule 300 dictates that a residence must be at most 300m away from a publicly accessible and usable green area of at least 1 hectare in size (10.000 m²). This requires calculating in which locations 1 hectare of qualifying green can be found, then computing the routes which allow reaching that green in 300m. | Rule 300 dictates that a residence must be at most 300m away from a publicly accessible and usable green area of at least 1 hectare in size (10.000 m²). This requires calculating in which locations 1 hectare of qualifying green can be found, then computing the routes which allow reaching that green in 300m. | ||
The Overlay "'''Rule-300 (Green nearby)'''" | The Overlay "'''Rule-300 (Green nearby)'''" demonstrates the results of calculation to test for this rule. The child Overlays are sub calculations which work towards the final result. | ||
The calculation also relies on 2 maps which are calculated | The calculation also relies on 2 maps which are calculated separately. | ||
* A map of {{inlink|Residences}} is created. Note that this can directly leverage the setup from the 3-rule as well. | * A map of {{inlink|Residences}} is created. Note that this can directly leverage the setup from the 3-rule as well. | ||
| Line 64: | Line 65: | ||
* [[Function Value]]s for pedestrian paths were modified, so that they have at least one [[Pedestrians per hour (Function Value)|pedestrian]]. | * [[Function Value]]s for pedestrian paths were modified, so that they have at least one [[Pedestrians per hour (Function Value)|pedestrian]]. | ||
* An [[Average Overlay]] creates a map of [[ | * An [[Average Overlay]] creates a map of [[Vegetation fraction (Function Value)|VEGETATION_FRACTION]]. | ||
* A [[Combo Overlay]] filters it, so that any remaining green is in a public space, and thus public green. | * A [[Combo Overlay]] filters it, so that any remaining green is in a public space, and thus public green. | ||
* An [[Average Overlay]] checks how much of the area within a 80 meter radius is public green. This provides a fraction of how much of such green is nearby. | * An [[Average Overlay]] checks how much of the area within a 80 meter radius is public green. This provides a fraction of how much of such green is nearby.<br>(A circle with 80 meter radius has an area of around 2 hectares total. This means 50% of the circle should be green to reach 1 hectare, allowing for capturing green structures with irregular shapes and extents.) | ||
* A [[Combo Overlay]] calculates from that fraction and the radius of 80 meters the amount of public green nearby, in m². | * A [[Combo Overlay]] calculates from that fraction and the radius of 80 meters the amount of public green nearby, in m². | ||
* A [[Combo Overlay]] checks whether the amount of public green nearby is sufficient to count for this rule. I.e. whether there is more than 10.000 m² (1 hectare). The result is points where there is 1 hectare nearby | * A [[Combo Overlay]] checks whether the amount of public green nearby is sufficient to count for this rule. I.e. whether there is more than 10.000 m² (1 hectare). The result is points where there is 1 hectare nearby. | ||
* An [[Average Overlay]] draws the 80 meter radii of those points. | * An [[Average Overlay]] draws the 80 meter radii of those points. | ||
* A [[Combo Overlay]] checks which public green overlaps with the computed radii. This results in a map which highlights all the public green which is part of a large enough green structure. | * A [[Combo Overlay]] checks which public green overlaps with the computed radii. This results in a map which highlights all the public green which is part of a large enough green structure. | ||
| Line 79: | Line 80: | ||
{{clear}} | {{clear}} | ||
===Sub-calculations=== | ===Sub-calculations=== | ||
For some of the rules to be implemented correctly, some other basic information needs to be rasterized. | For some of the rules to be implemented correctly, some other basic information needs to be rasterized. | ||
| Line 84: | Line 86: | ||
====Residences==== | ====Residences==== | ||
[[File:Demo-3-30-300-residences.jpg|thumb|right|300px|Estimations of buildings with residential units.]] | [[File:Demo-3-30-300-residences.jpg|thumb|right|300px|Estimations of buildings with residential units.]] | ||
{{main|How to make a Grid Overlay of residences}} | |||
Residences can be rasterized as follows: | Residences can be rasterized as follows: | ||
* First creating multiple [[Average Overlay]]s which obtain the individual [[Unit size (Function Value)|unit sizing]] per category of residence. | * First creating multiple [[Average Overlay]]s which obtain the individual [[Unit size (Function Value)|unit sizing]] per category of residence. | ||
* The results can then be combined in a [[Combo Overlay]]. | * The results can then be combined in a [[Combo Overlay]]. | ||
{{clear}} | {{clear}} | ||
====Residence walls==== | ====Residence walls==== | ||
[[File:Demo-3-30-300-walls-of-residences.jpg|thumb|right|300px|Estimations of the outside walls of buildings with residential units.]] | [[File:Demo-3-30-300-walls-of-residences.jpg|thumb|right|300px|Estimations of the outside walls of buildings with residential units.]] | ||
Determining the locations of walls requires finding the places where the [[DSM]] makes a sudden jump upward. This can be done | {{main|How to make a Grid Overlay of residence walls}} | ||
Determining the locations of walls requires finding the places where the [[DSM]] makes a sudden jump upward. This can be done by spatially smoothing the DSM out. | |||
* Add a [[Heightmap Overlay]] set to [[DTM]]. | * Add a [[Heightmap Overlay]] set to [[DTM]]. | ||
* Add a [[Heightmap Overlay]] set to [[DSM]]. | * Add a [[Heightmap Overlay]] set to [[DSM]]. | ||
* Add an [[Average Overlay]], which slightly averages out the [[DSM]] spatially. | * Add an [[Average Overlay]], which slightly averages out the [[DSM]] spatially. | ||
* Add a [[Combo Overlay]] which checks that the averaged DSM is greater than the DTM as well as the DSM. This provides a map where places are highlighted where there are changes in height due to [[Building]]s being present, and will specifically find cells just on the "outside" of the wall. | * Add a [[Combo Overlay]] which checks that the averaged DSM is greater than the DTM as well as the DSM. This provides a map where places are highlighted where there are changes in height due to [[Building]]s being present, and will specifically find cells just on the "outside" of the wall. | ||
* Add an [[Average Overlay]] which slightly averages the {{inlink| | * Add an [[Average Overlay]] which slightly averages the {{inlink|lcase=true|Residences}}, so for any residential [[Building]] a few cells around it have a non-zero value as well. | ||
* Use a [[Combo Overlay]] to finds all the cells which are both height differences just outside walls, and just outside residences. | * Use a [[Combo Overlay]] to finds all the cells which are both height differences just outside walls, and just outside residences. | ||
{{clear}} | |||
====Public space==== | ====Public space==== | ||
[[File:Demo-3-30-300-public-space.jpg|thumb|right|300px|Estimation of public spaces.]] | [[File:Demo-3-30-300-public-space.jpg|thumb|right|300px|Estimation of public spaces.]] | ||
| Line 117: | Line 112: | ||
* Add an [[Average Overlay]] set to the [[Attribute]] "SOLID" (to find structures) | * Add an [[Average Overlay]] set to the [[Attribute]] "SOLID" (to find structures) | ||
* Add an [[Average Overlay]] set to the [[Attribute]] "NUM_TRAINS" (to find train tracks) | * Add an [[Average Overlay]] set to the [[Attribute]] "NUM_TRAINS" (to find train tracks) | ||
* Add a [[Combo Overlay]] to combine the results together, and flip the results. Any location in which any of the described conditions can be found is not public. Any place where | * Add a [[Combo Overlay]] to combine the results together, and flip the results. Any location in which any of the described conditions can be found is not public. Any place where none of the described conditions are found can be considered public space. | ||
More conditions can be added in future implementations, depending on the required accuracy of the estimation, and the specific features expected to be present in any environment. | More conditions can be added in future implementations, depending on the required accuracy of the estimation, and the specific features expected to be present in any environment. | ||
| Line 127: | Line 122: | ||
An [[Indicator]] can use queries to automatically aggregate values from [[Overlay]]s and display statistical results. Because all the result [[Overlay]]s produce either a NO_DATA (ignorable), 0 (does not meet requirements), or 1 (meets requirements), the following query can be permuted in 6 variants (3 overlays and 2 values) to compute a score for each of the 3 rules: | An [[Indicator]] can use queries to automatically aggregate values from [[Overlay]]s and display statistical results. Because all the result [[Overlay]]s produce either a NO_DATA (ignorable), 0 (does not meet requirements), or 1 (meets requirements), the following query can be permuted in 6 variants (3 overlays and 2 values) to compute a score for each of the 3 rules: | ||
<code>SELECT_LANDSIZE_WHERE_NEIGHBORHOOD_IS_X_AND_GRID_WITH_ATTRIBUTE_IS_[attribute]_AND_MINGRIDVALUE_IS_[value]</code> | |||
The [[Overlay]]s for rule-3, rule-30, and rule-300 have been given the [[Attribute]]s OVERLAY_RULE_3, OVERLAY_RULE_30, and OVERLAY_RULE_300 respectively. | The [[Overlay]]s for rule-3, rule-30, and rule-300 have been given the [[Attribute]]s OVERLAY_RULE_3, OVERLAY_RULE_30, and OVERLAY_RULE_300 respectively. | ||
| Line 137: | Line 132: | ||
{{article end| | {{article end| | ||
notes= | notes= | ||
* The implementations defined in this Project are not explicitly | * The implementations defined in this Project are not explicitly expert-reviewed, but their principles have been repeatedly been deemed sufficient by organizations intending to test environments and plans on the 3-30-300 guidelines. | ||
** Other org, organizations, such as [https://nlgreenlabel.nl/ NLGreenlabel] and [https://urbansync.nl/ UrbanSync], have developed their own implementations based on their own expertise and insights. Although these implementations differ from the method described here, each method of calculation follows the directive set forth by the 3-30-300 guidelines. | |||
* A key aspect of the calculations is the presence of trees. Although the described and demonstrated methodology functions using the default trees dataset offered at [[Project generation]] time by the {{software}}, it is also possible to replace the default trees dataset with a custom and more accurate dataset, either provided by the relevant municipality or other official organization, or by commercial parties. | |||
|references= | |references= | ||
<references> | <references> | ||
| Line 148: | Line 145: | ||
|lastvisit= 21-08-2023 | |lastvisit= 21-08-2023 | ||
}} | }} | ||
</references> | </references> | ||
}} | }} | ||
Latest revision as of 05:33, 12 October 2023
The Demo 3-30-300 project is available for all users and can be found in the main menu under Edit projects. This project does not count towards your license.
This project is intended for people who are working in fields such as climate adaptation, livability, policies regarding green environments, and urban planning.
This project showcases a method for calculating the 3-30-300 policy guidelines in the Tygron Platform.
The demo is a working project in which a number of generally available Grid Overlays in the Tygron Platform are combined to perform specific policy-dictated calculations. Following the 3-30-300 guidelines as closely as possible, these methods calculate sight-lines onto trees, foliage coverage, and distance to significant usable green spaces.
3-30-300
3-30-300 is a set of policy guidelines which are intended to provide consistent and testable metric for a green urban environment[1]. These guidelines have been composed externally but can be implemented in Project in the Tygron Platform freely. The name refers to the separate guidelines which are each defined by one of the numbers. The guidelines are always combined for a complete consideration, but the individual rules and their implementations are best described separately.
Although the guidelines are well known, they also leave room to interpretation and thus varying implementations. The implementations demonstrated here strike a balance between leveraging the Tygron Platform's effective means of calculation and the flexibility and verisimilitude of the results. As such, they serve as a powerful springboard for creating ones own accepted means of calculation.
3-30-300 Implementation
Each rule is codified in an Overlay, with a number of sub Overlays. The sub Overlays each form a step in the total calculation, and are in the order that the steps in the calculation are taken. By first inspecting the parent Overlay, the net result can be seen. Then, by inspecting the sub Overlays in order, the calculations can be progressively made clear.
Some calculations are performed separately and are explained separately. This is because the calculations are complex and warrant the ability to understand what is happening separate from the greater calculation, or because the calculations are reused between rules. The results of these separate calculations are separate Overlays, with their own sub Overlays for their own calculations.
Rule-3
- Main article: How to compute residential walls with sight of trees
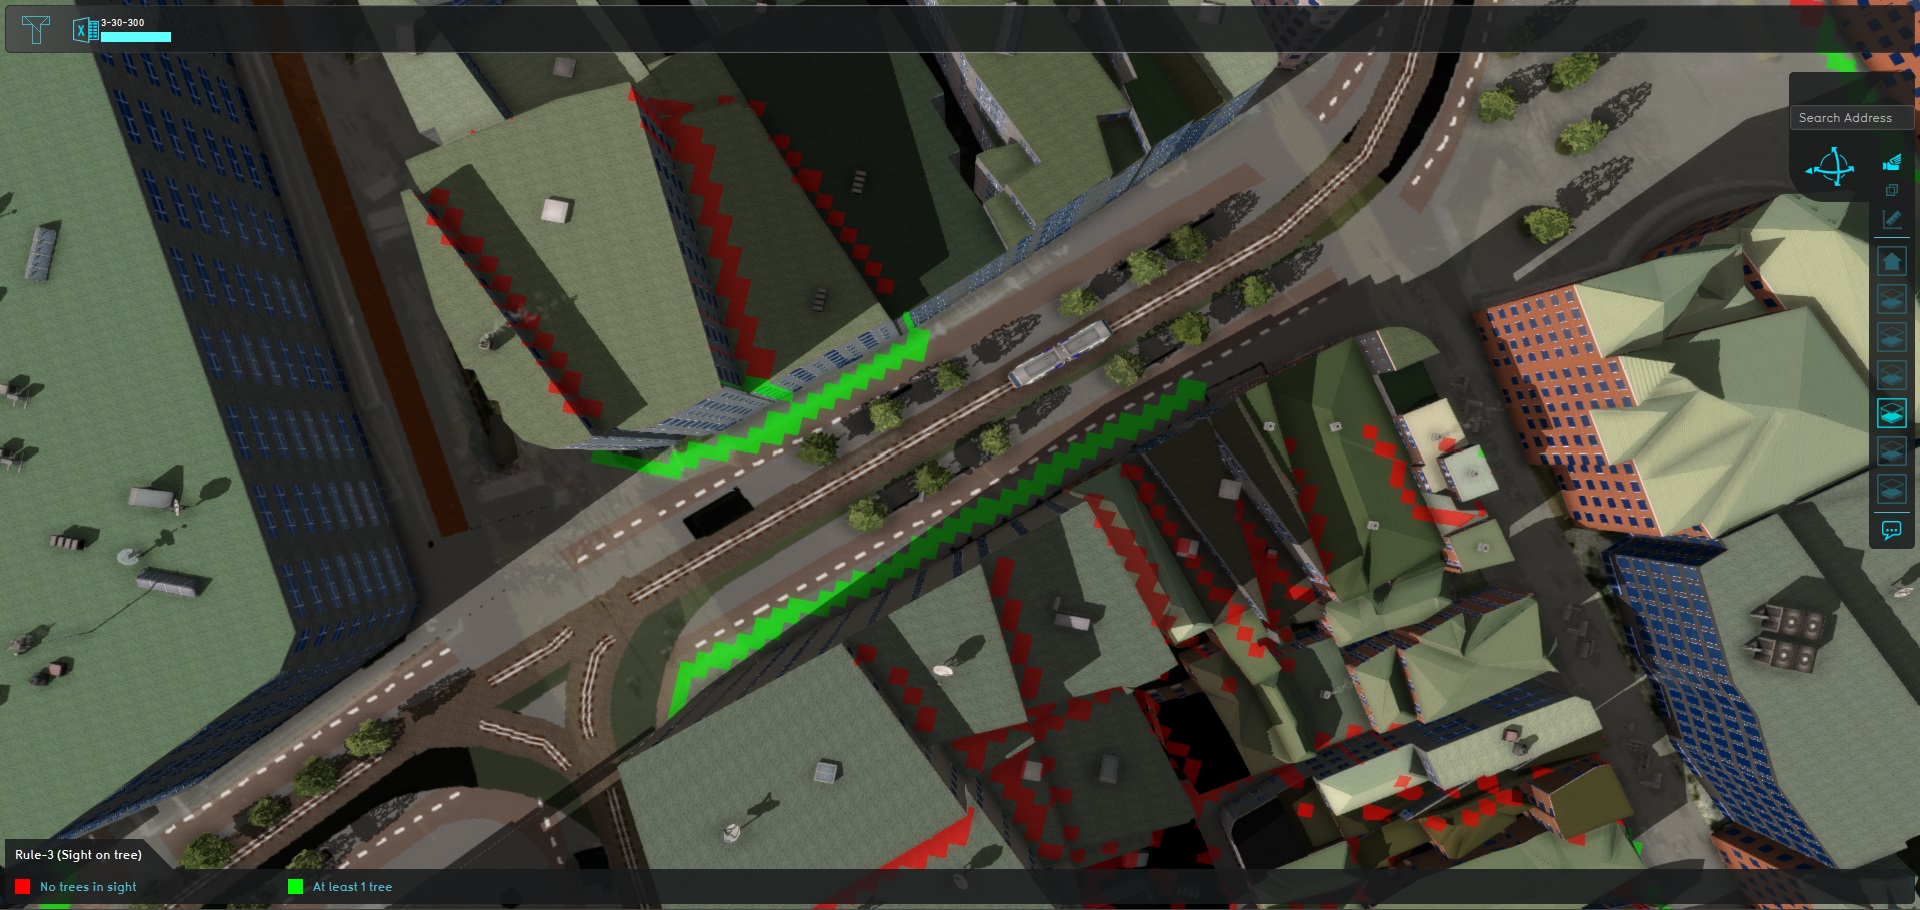
Rule 3 dictates that, from any residence, at least 3 trees should be visible. Although explicitly counting the amount of trees is currently not possible, it ís possible to draw sight-lines from trees, detect outside walls of residences, and combine the two to find the walls which do or do not have sight on a tree.
The Overlay "Rule-3 (Sight on tree)" demonstrates the results of calculation to test for this rule. The child Overlay is a sub calculation which works towards the final result.
The calculation also relies on 2 maps which are calculated separately.
- A map of Residences is created.
- A map of Walls of residences is created.
- An additional Attribute is attached to Functions of trees, indicating the distance at which they can be seen.
- A Sight Distance Overlay is used to draw sight-lines to trees, by referring to that Attribute.
- A Combo Overlay combines Walls of residences and tree sight-lines, to display which walls can or cannot see a tree.
Rule-30
- Main article: How to compute the presence of foliage in public spaces
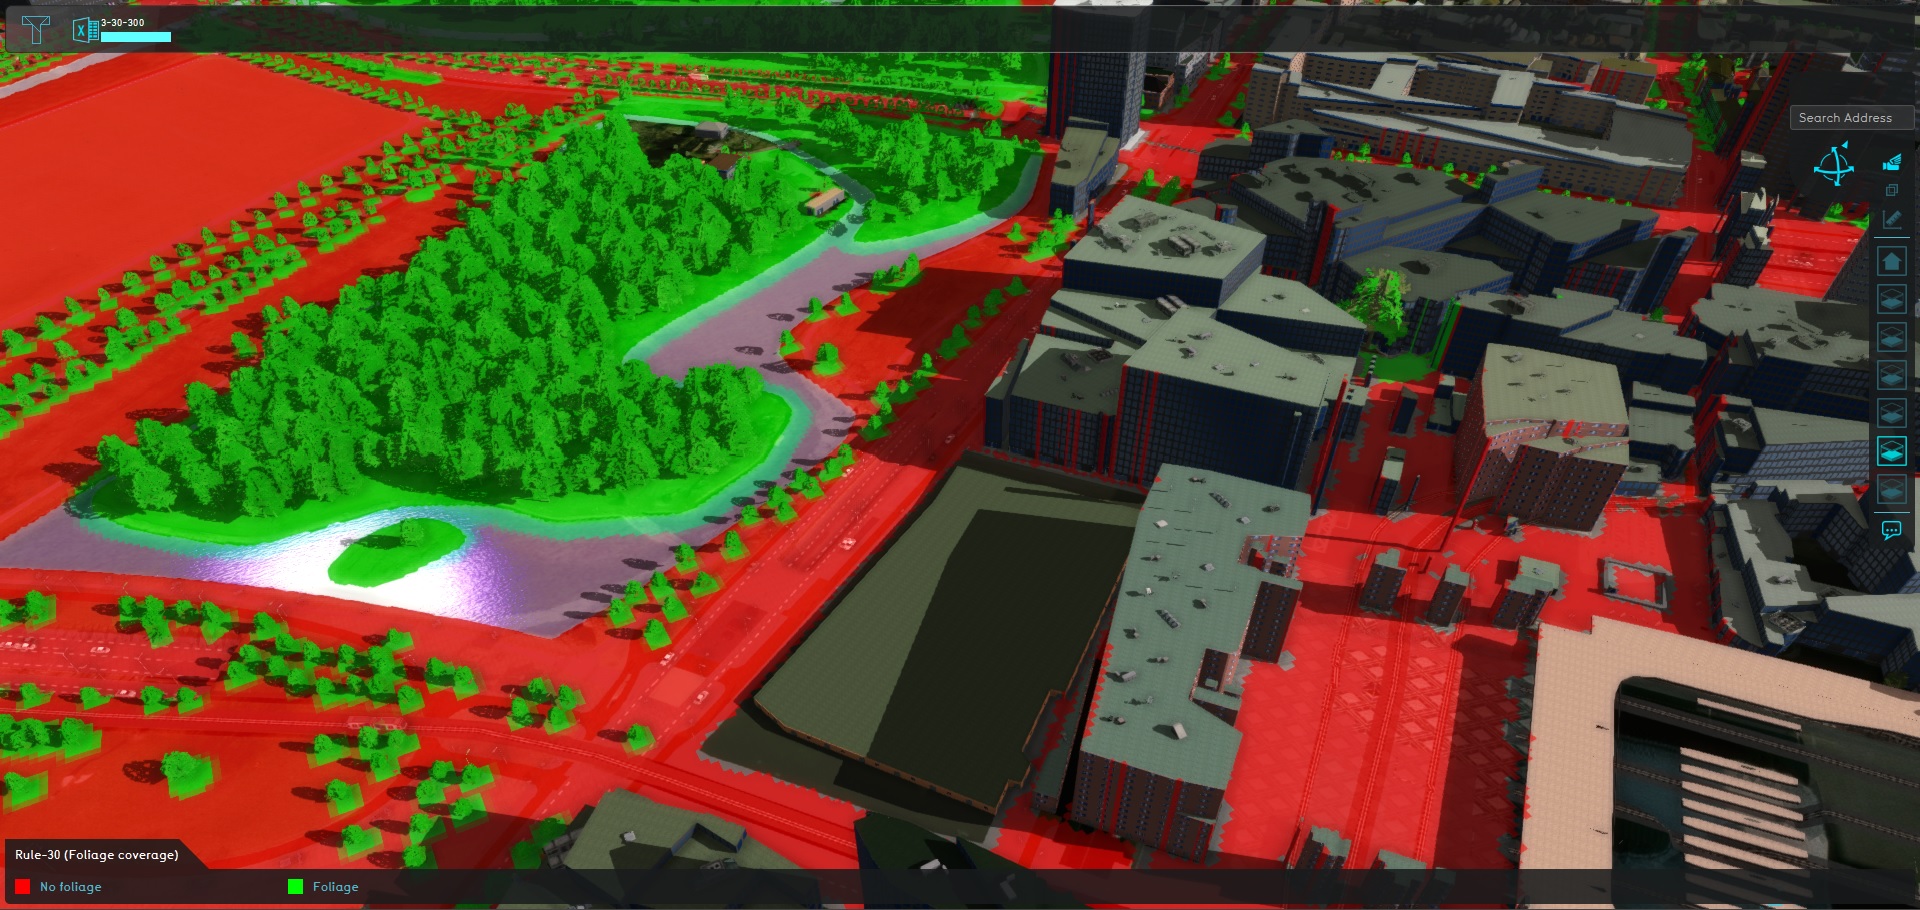
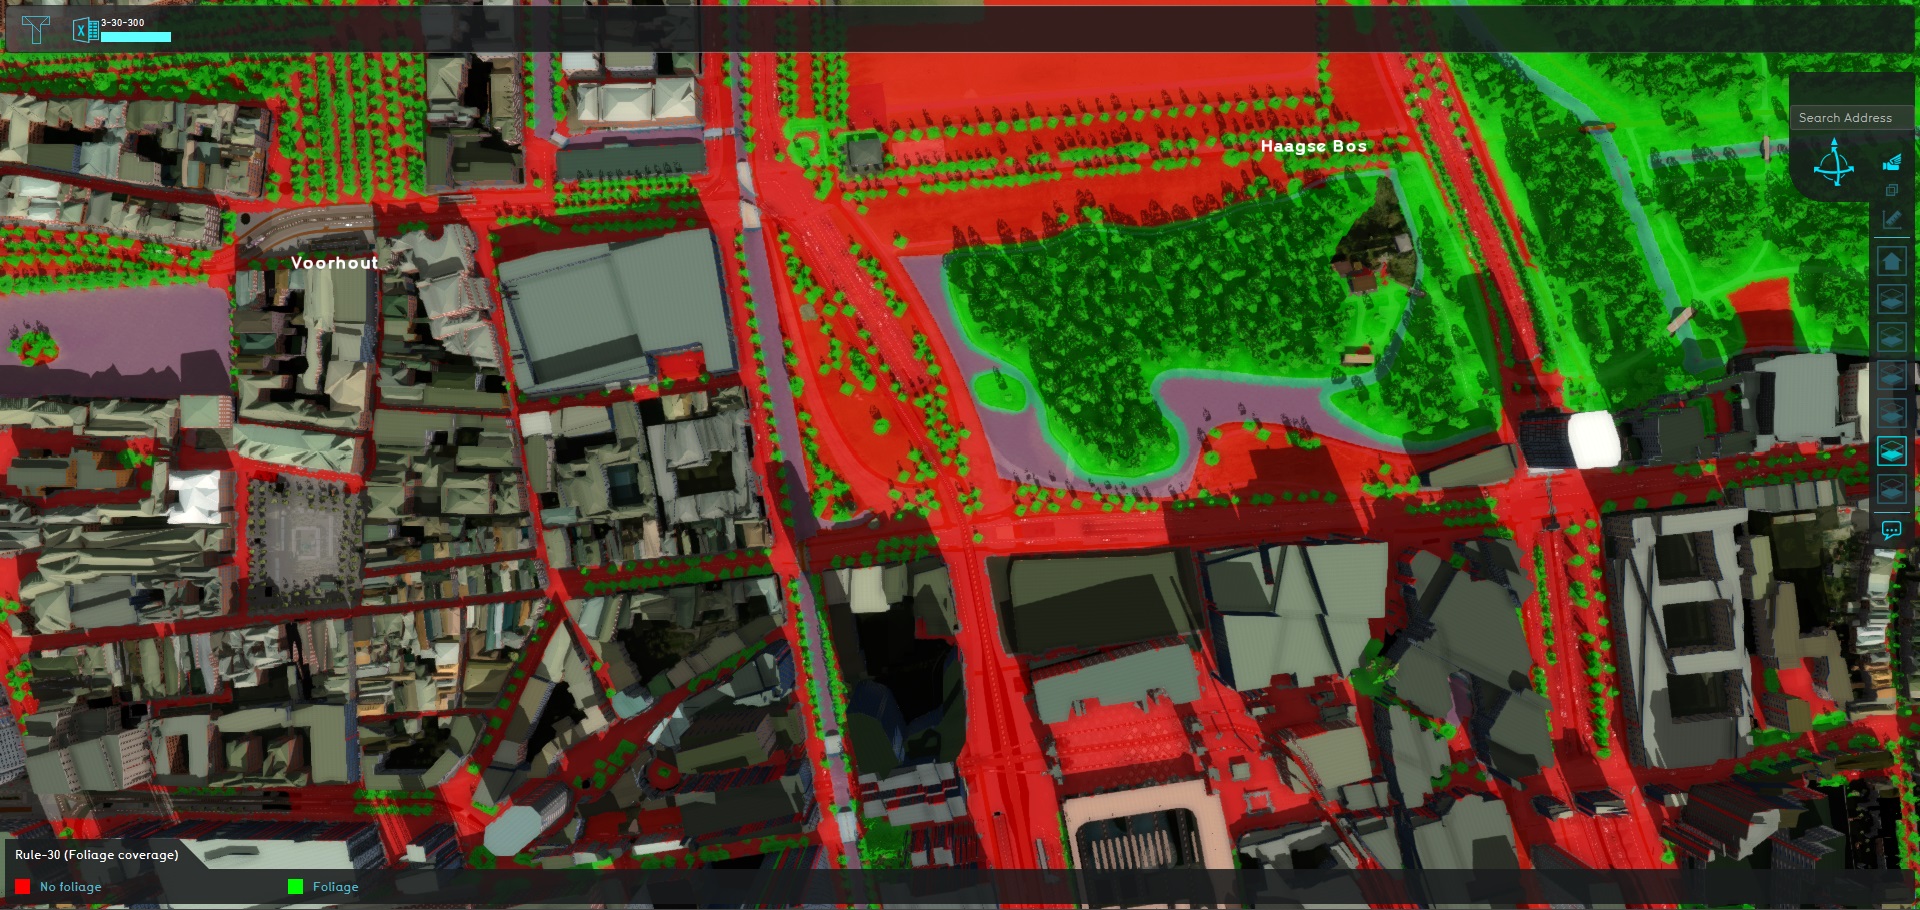
Rule 30 dictates that 30% of the public space must feature foliage. The Tygron Platform offers some options for estimating the presence of foliage. The definition of public space can be manually defined with a few simple rules.
The Overlay "Rule-30 (Foliage coverage)" demonstrates the results of calculation to test for this rule. The child Overlay is a sub calculation which works towards the final result.
The calculation also relies on a map which is calculated separately.
- A map of Public space is created.
- A Heat Stress Overlay is used, set to the Foliage result type, leverages a built-in method to obtain foliage heights.
- A Combo Overlay combines Public space and Foliage, to display which public locations are also covered by foliage.
Rule-300
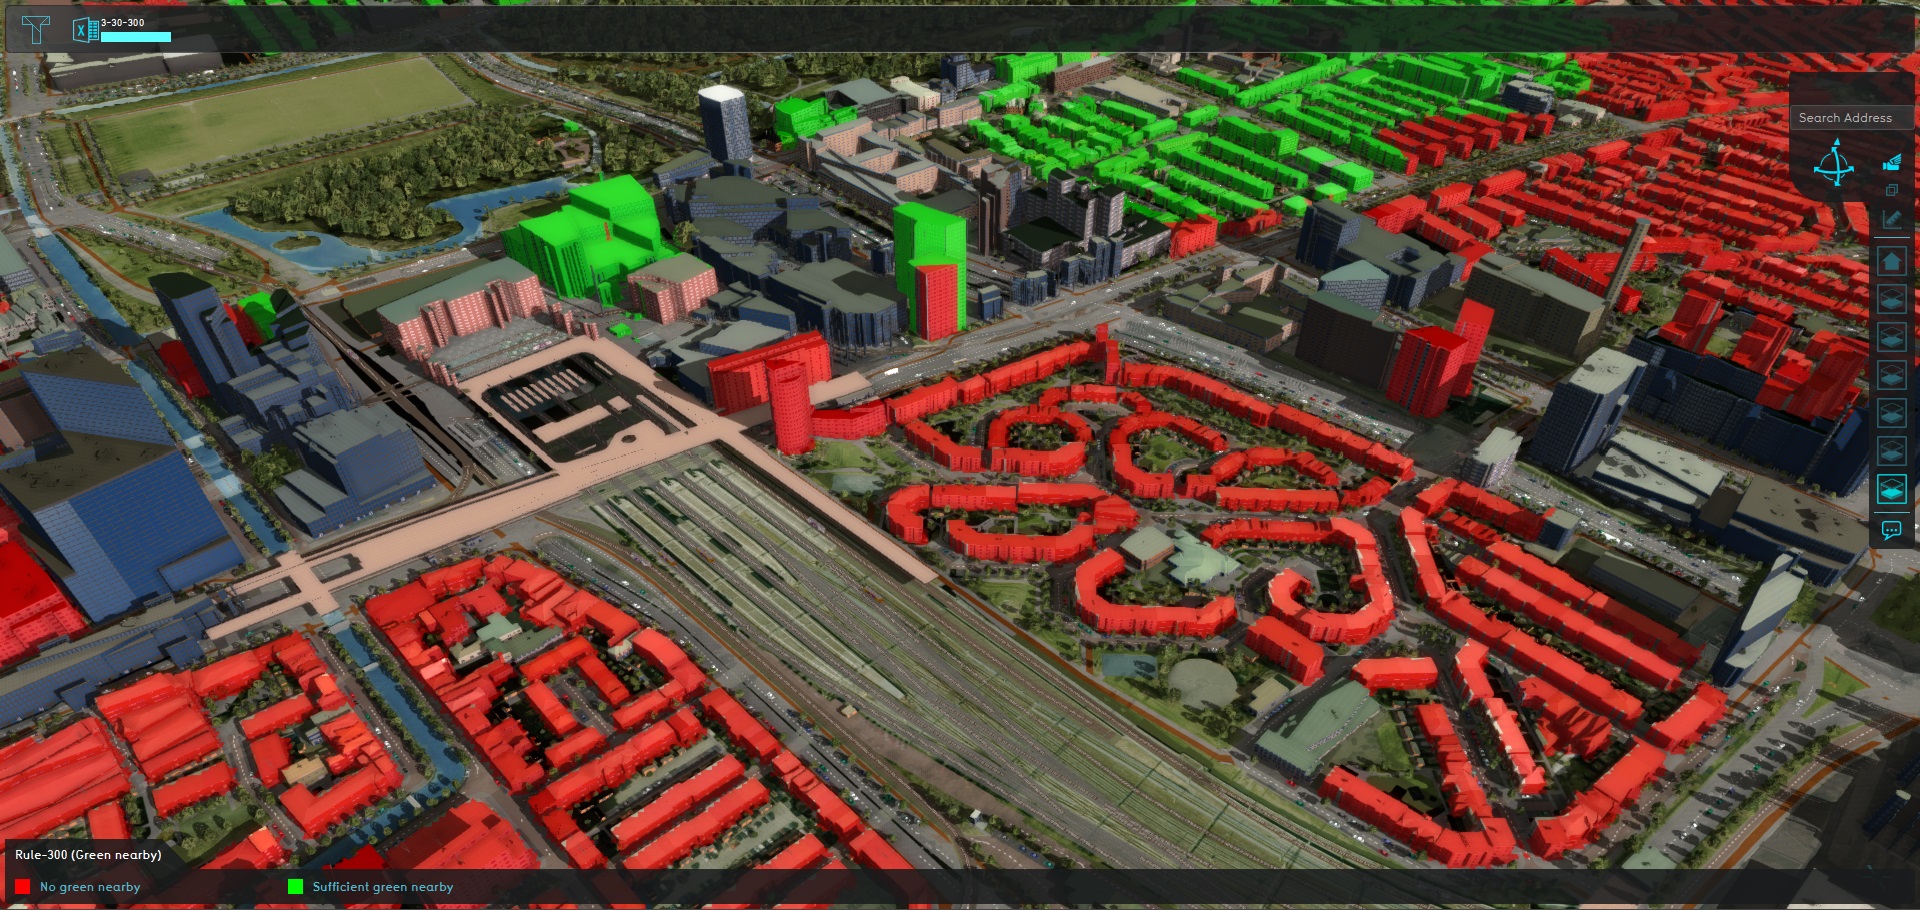
Rule 300 dictates that a residence must be at most 300m away from a publicly accessible and usable green area of at least 1 hectare in size (10.000 m²). This requires calculating in which locations 1 hectare of qualifying green can be found, then computing the routes which allow reaching that green in 300m.
The Overlay "Rule-300 (Green nearby)" demonstrates the results of calculation to test for this rule. The child Overlays are sub calculations which work towards the final result.
The calculation also relies on 2 maps which are calculated separately.
- A map of Residences is created. Note that this can directly leverage the setup from the 3-rule as well.
- A map of Public space is created. Note that this can directly leverage the setup from the 30-rule as well.
- Function Values for bicycle paths were modified, so that they have at least one bicycle.
- Function Values for pedestrian paths were modified, so that they have at least one pedestrian.
- An Average Overlay creates a map of VEGETATION_FRACTION.
- A Combo Overlay filters it, so that any remaining green is in a public space, and thus public green.
- An Average Overlay checks how much of the area within a 80 meter radius is public green. This provides a fraction of how much of such green is nearby.
(A circle with 80 meter radius has an area of around 2 hectares total. This means 50% of the circle should be green to reach 1 hectare, allowing for capturing green structures with irregular shapes and extents.) - A Combo Overlay calculates from that fraction and the radius of 80 meters the amount of public green nearby, in m².
- A Combo Overlay checks whether the amount of public green nearby is sufficient to count for this rule. I.e. whether there is more than 10.000 m² (1 hectare). The result is points where there is 1 hectare nearby.
- An Average Overlay draws the 80 meter radii of those points.
- A Combo Overlay checks which public green overlaps with the computed radii. This results in a map which highlights all the public green which is part of a large enough green structure.
- A Travel Distance Overlay, set to a distance of 300m, uses the green structures as destinations. It is set to allow travel routes based on bicycles and pedestrians.
- A Combo Overlay combines Walls of residences and travel distance, to display which residences are or are not in the specified distance.
Techniques
This calculation makes use of the following technique(s):
Sub-calculations
For some of the rules to be implemented correctly, some other basic information needs to be rasterized.
Residences
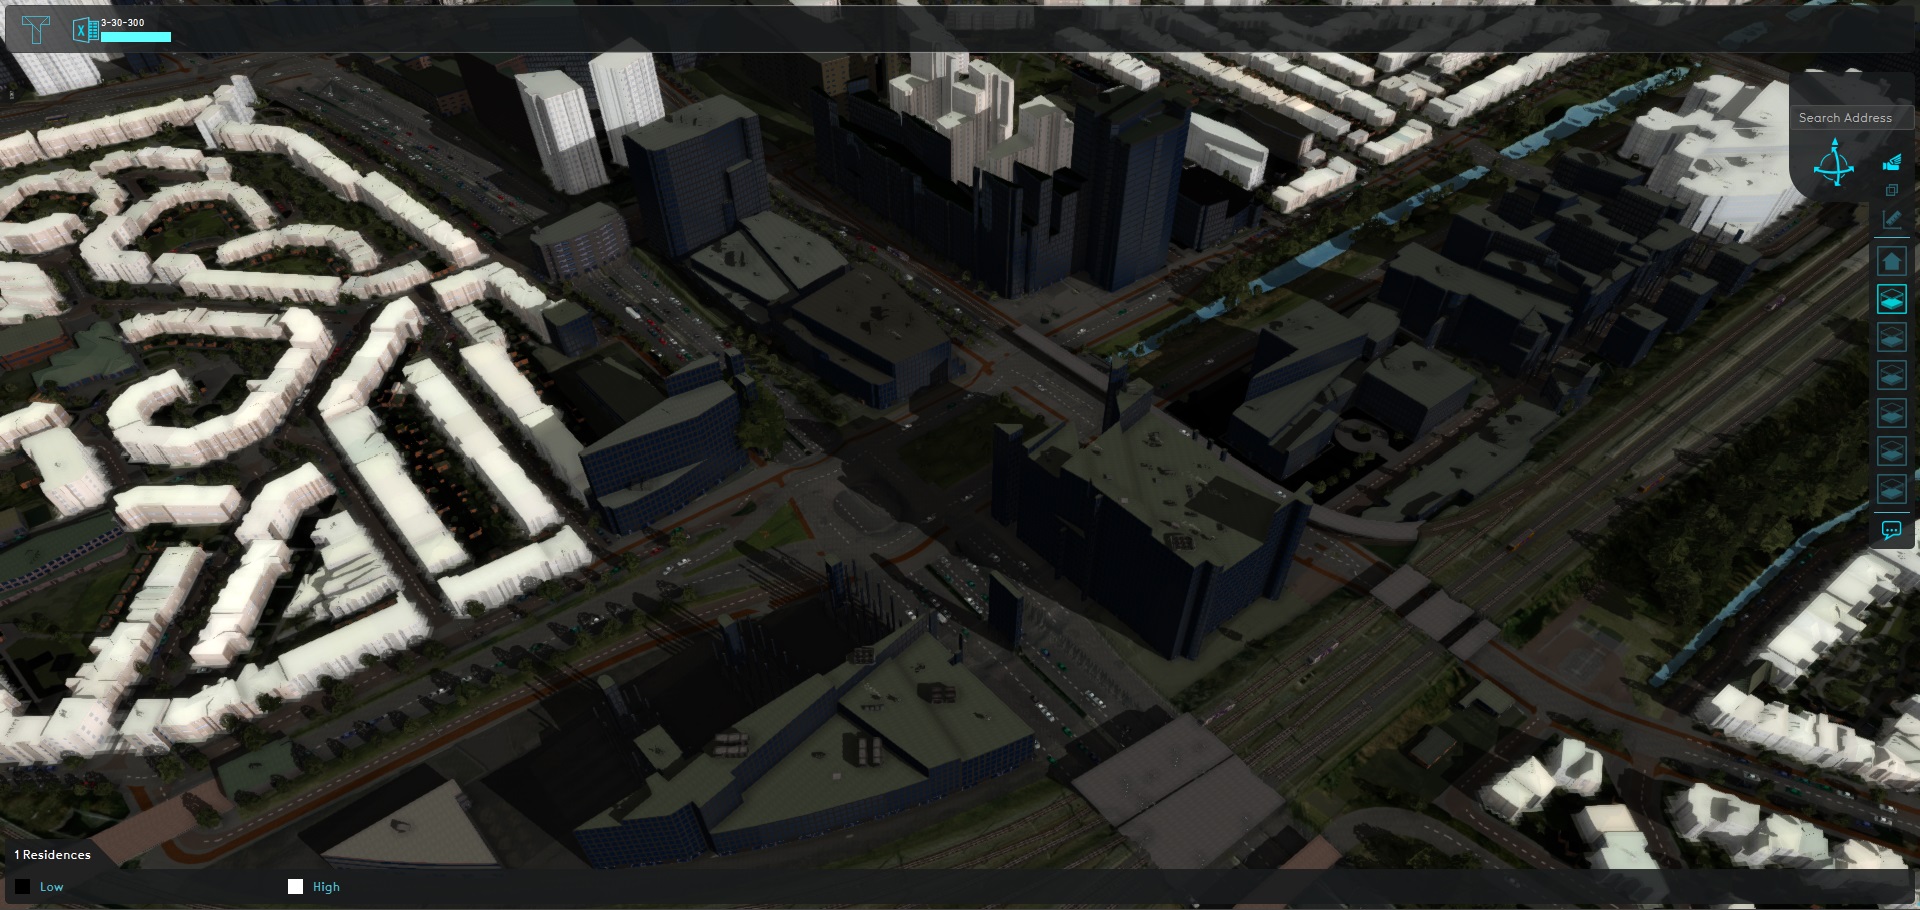
- Main article: How to make a Grid Overlay of residences
Residences can be rasterized as follows:
- First creating multiple Average Overlays which obtain the individual unit sizing per category of residence.
- The results can then be combined in a Combo Overlay.
Residence walls
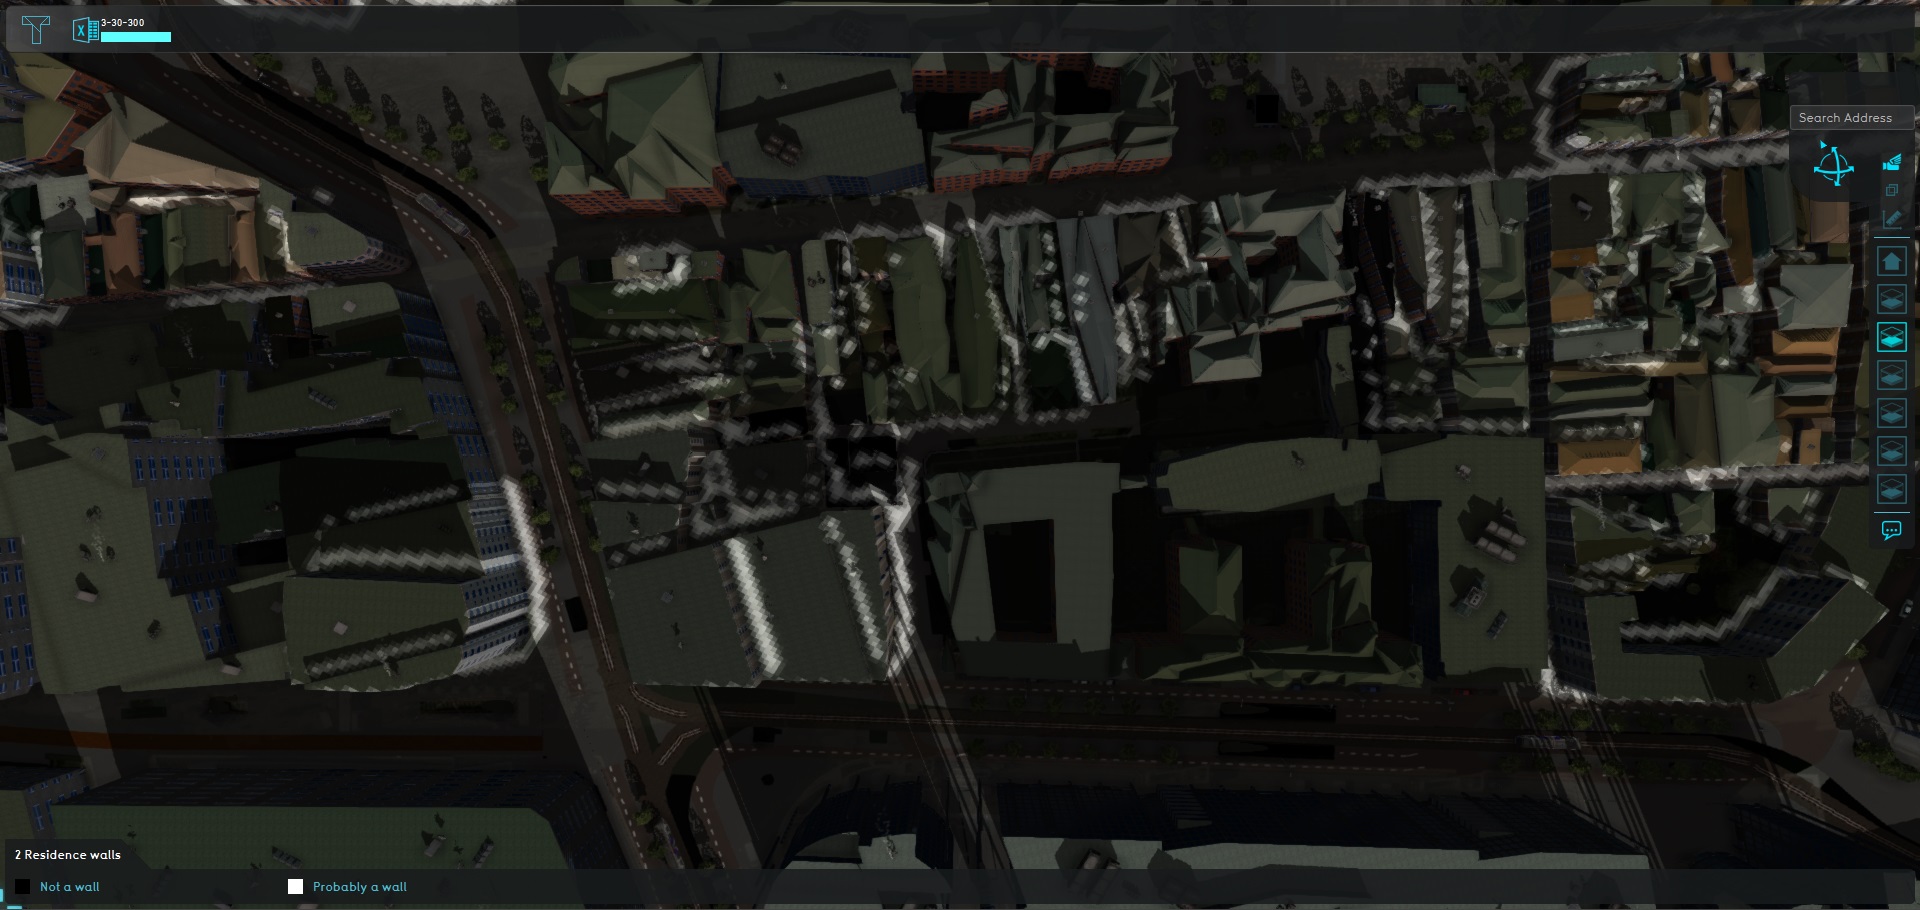
- Main article: How to make a Grid Overlay of residence walls
Determining the locations of walls requires finding the places where the DSM makes a sudden jump upward. This can be done by spatially smoothing the DSM out.
- Add a Heightmap Overlay set to DTM.
- Add a Heightmap Overlay set to DSM.
- Add an Average Overlay, which slightly averages out the DSM spatially.
- Add a Combo Overlay which checks that the averaged DSM is greater than the DTM as well as the DSM. This provides a map where places are highlighted where there are changes in height due to Buildings being present, and will specifically find cells just on the "outside" of the wall.
- Add an Average Overlay which slightly averages the residences, so for any residential Building a few cells around it have a non-zero value as well.
- Use a Combo Overlay to finds all the cells which are both height differences just outside walls, and just outside residences.
Public space
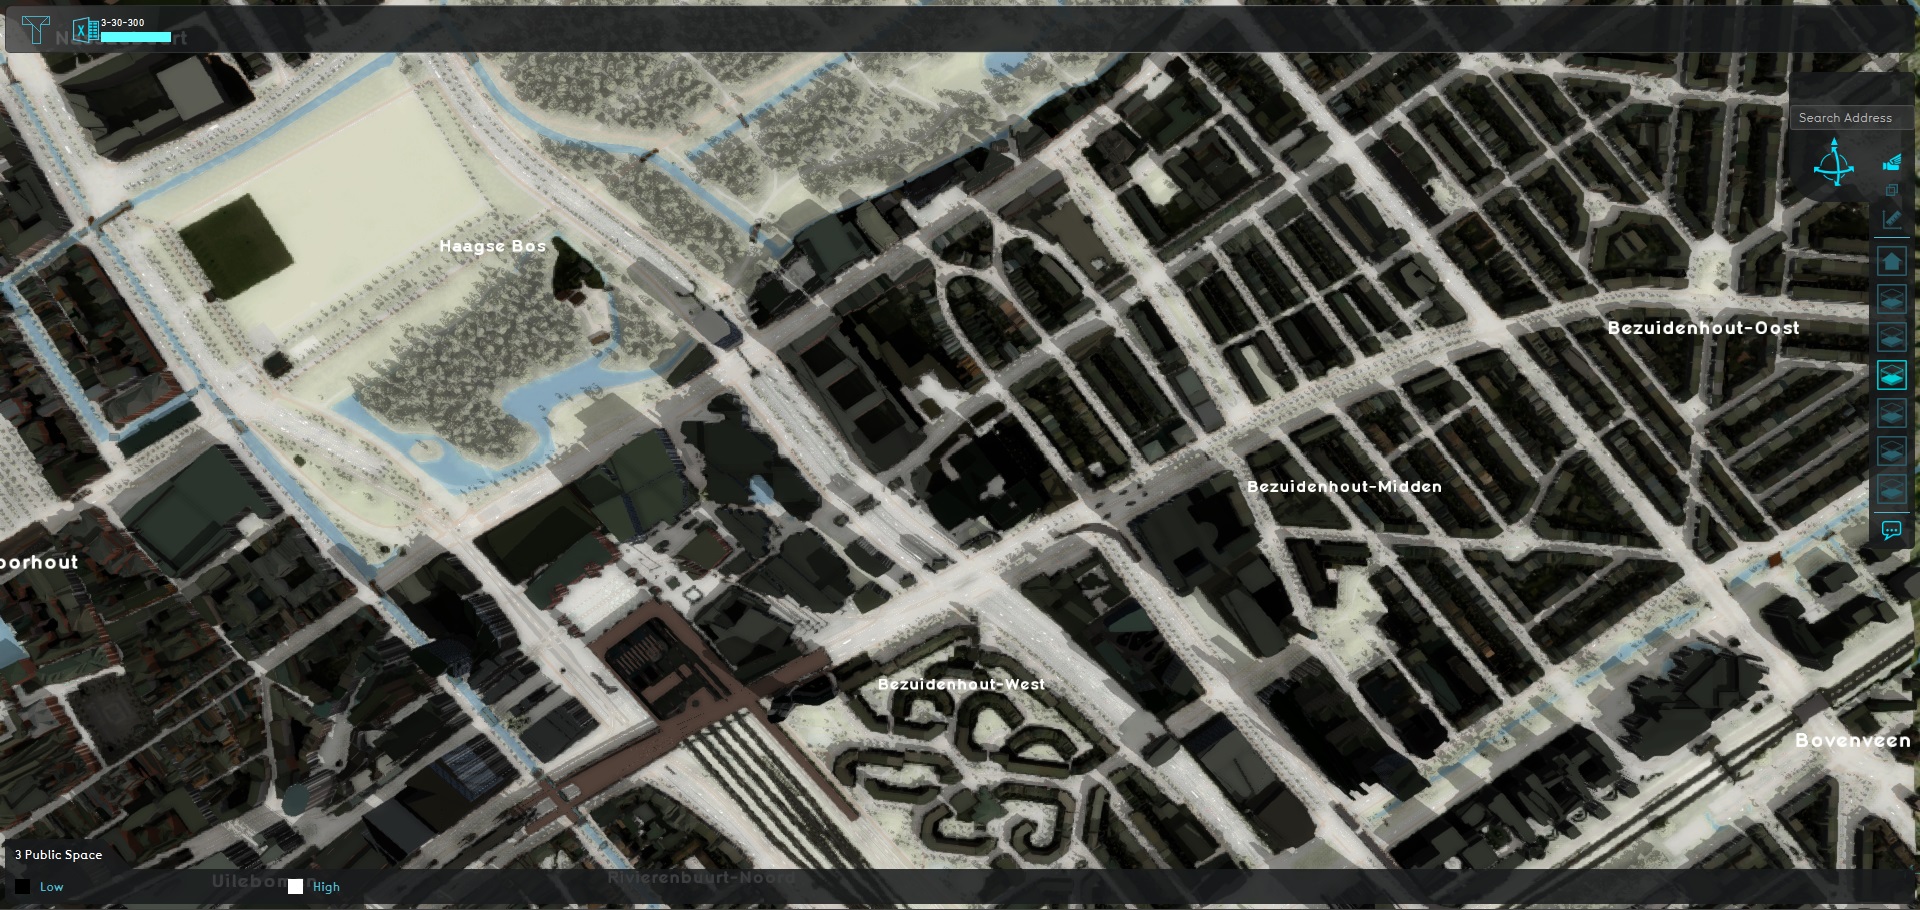
Public spaces can either be determined by testing what is, or testing what isn't public space. The approach used in this project is by testing what isn't public space.
- Add an Average Overlay set to the Attribute "PRIVATE_YARD" (to find yards)
- Add an Average Overlay set to the Attribute "SOLID" (to find structures)
- Add an Average Overlay set to the Attribute "NUM_TRAINS" (to find train tracks)
- Add a Combo Overlay to combine the results together, and flip the results. Any location in which any of the described conditions can be found is not public. Any place where none of the described conditions are found can be considered public space.
More conditions can be added in future implementations, depending on the required accuracy of the estimation, and the specific features expected to be present in any environment.
Indicator
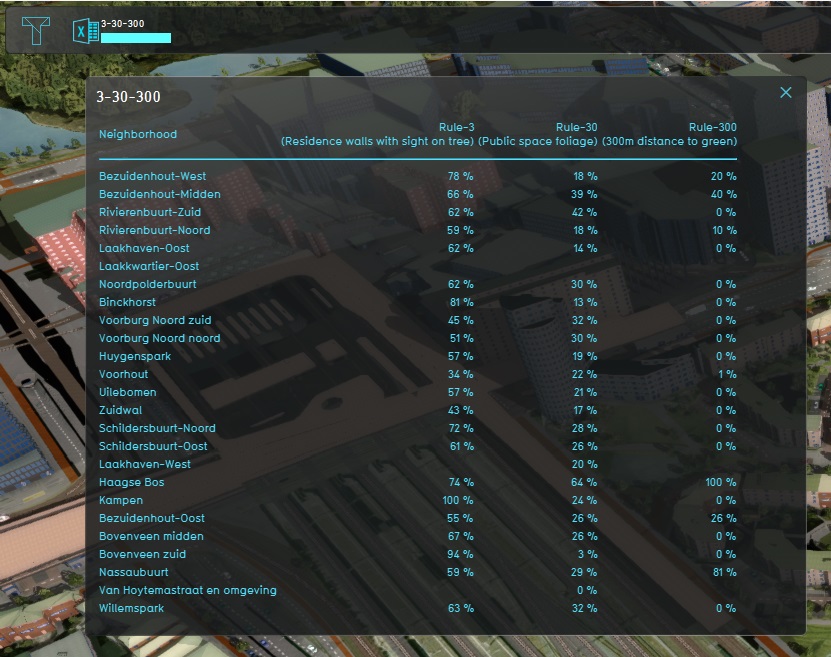
An Indicator can use queries to automatically aggregate values from Overlays and display statistical results. Because all the result Overlays produce either a NO_DATA (ignorable), 0 (does not meet requirements), or 1 (meets requirements), the following query can be permuted in 6 variants (3 overlays and 2 values) to compute a score for each of the 3 rules:
SELECT_LANDSIZE_WHERE_NEIGHBORHOOD_IS_X_AND_GRID_WITH_ATTRIBUTE_IS_[attribute]_AND_MINGRIDVALUE_IS_[value]
The Overlays for rule-3, rule-30, and rule-300 have been given the Attributes OVERLAY_RULE_3, OVERLAY_RULE_30, and OVERLAY_RULE_300 respectively.
The values are 0, or 1, for "all testable locations" and "all good locations" respectively.
Results are aggregated per Neighborhood.
Notes
- The implementations defined in this Project are not explicitly expert-reviewed, but their principles have been repeatedly been deemed sufficient by organizations intending to test environments and plans on the 3-30-300 guidelines.
- Other org, organizations, such as NLGreenlabel and UrbanSync, have developed their own implementations based on their own expertise and insights. Although these implementations differ from the method described here, each method of calculation follows the directive set forth by the 3-30-300 guidelines.
- A key aspect of the calculations is the presence of trees. Although the described and demonstrated methodology functions using the default trees dataset offered at Project generation time by the Tygron Platform, it is also possible to replace the default trees dataset with a custom and more accurate dataset, either provided by the relevant municipality or other official organization, or by commercial parties.
References
- ↑ Promoting health and wellbeing through urban forests – Introducing the 3-30-300 rule ∙ Prof. C. Konijnendijk van den Bosch ∙ IUCN Urban Alliance ∙ Found at: https://iucnurbanalliance.org/promoting-health-and-wellbeing-through-urban-forests-introducing-the-3-30-300-rule/ ∙ (last visited: 21-08-2023)