How to access your project data in Power BI
Jump to navigation
Jump to search
Data from projects can be accessed by Power BI Desktop using a web connection for the GeoJSON endpoint.
Editor → Current Situation (Ribbon tab) → Administrative (Ribbon bar) → Show Neighborhoods (Dropdown)
How to access your project data in Power BI:
- Open any project, and preferable put it on Keep alive.
- Choose an item that you want connect to, such as Neighborhoods.
- Hover over Neighborhoods, and in the popup select Export Geo data.
- As the format, select GeoJSON (Convert collections to MultiPolygons).
- Click on the second Copy URL button, next to Online GeoJSON Endpoint.
- Open the Power BI Desktop application.
- Create a new project or open an existing one.
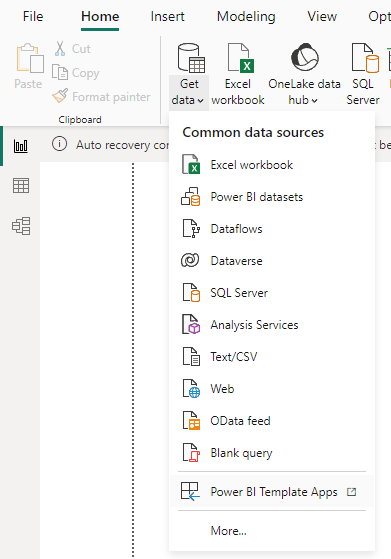
- Under add Get Data, select Web.
- Paste the link in the url field and select Ok.
- In the Access Web content step, choose the default option and select Connect.
- A new panel opens, and by default, a table is created of all the properties.
- Click on the Close and Apply button.
- In the Visualization panel, select the second option named Stacked column chart.
- A preview should be added to your page section, indicating you need to drag or select a field.
- In the Visualization panel, identify the X-Axis data field.
- In the Data panel, unfold the connection and drag the name field from the list of properties to the X-Axis data field.
- Next, select a value property, such as AANTAL_INWONERS and drag this property to the Y-Axis data field.
- The bar chart should now be created.
-
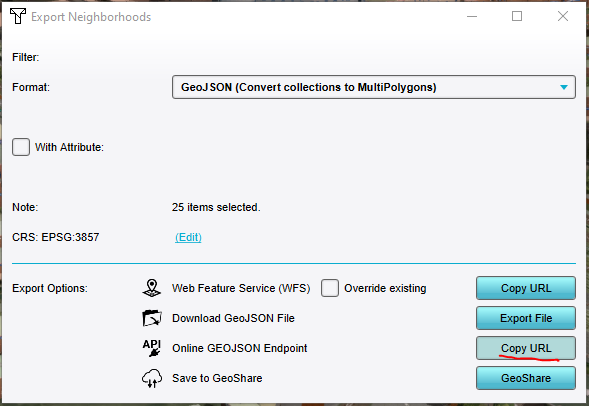 Copy URL for "Neighborhoods as GeoJSON"-endpoint.
 -
 Paste the URL and create a web connection.
 -
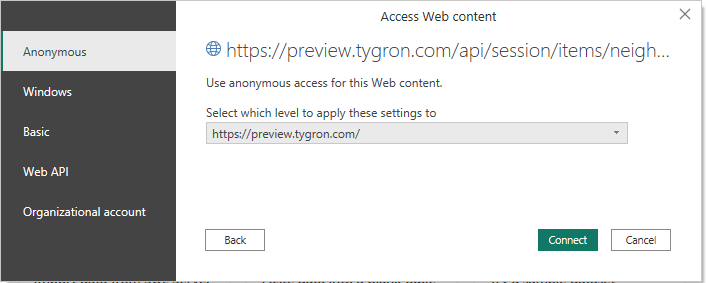 Choose anonymous connection.
 -
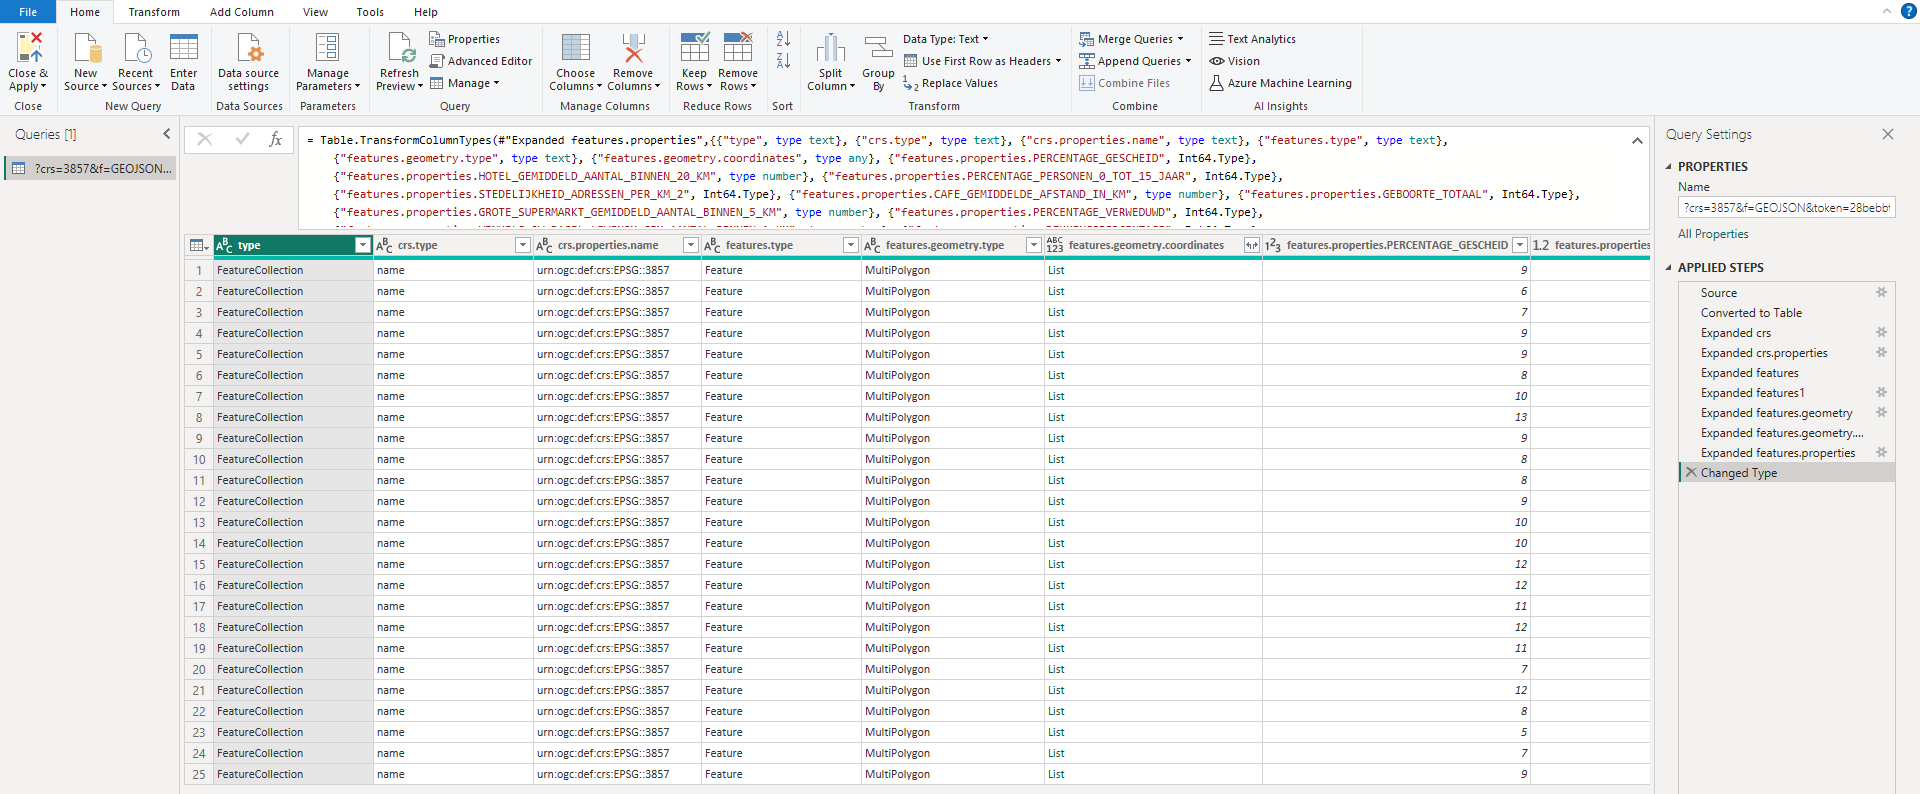 Created table for the GeoJSON web connection.
 -
 Close and apply.
 -
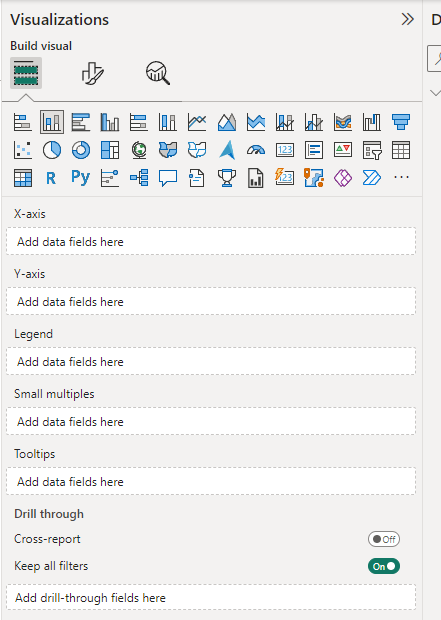 Vertical bar chart selected from the Visuals.
 -
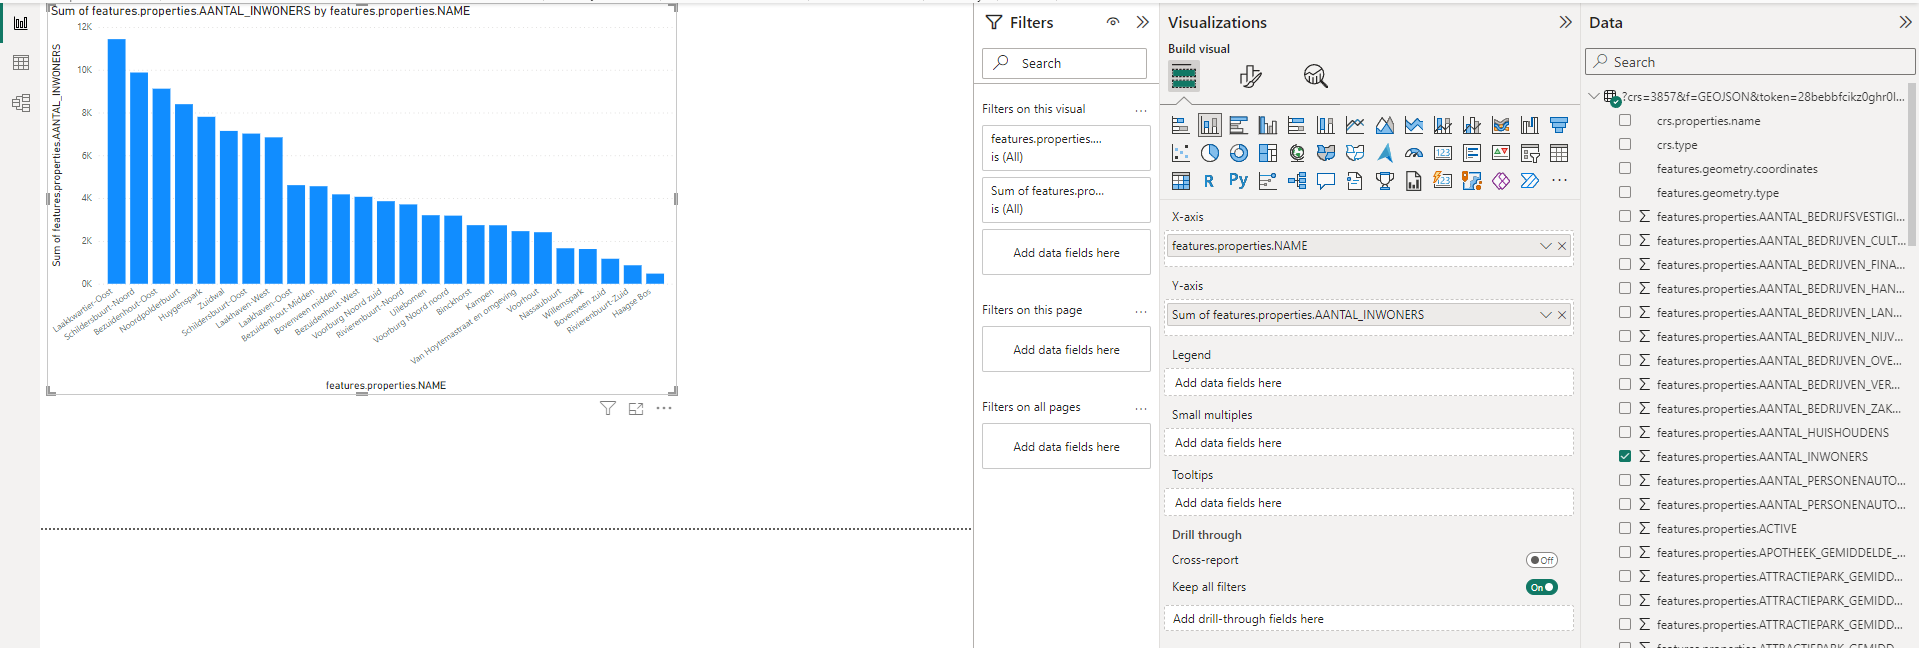 Stacked column chart with neighborhood name and number of inhabitants.


Notes
- Use the search bar in Power BI to filter data fields.
How-to's
- How to show Indicator results in Power BI
- How to show Overlays in Power BI
- How to show polygon data in Power BI