How to show Overlays in Power BI
Jump to navigation
Jump to search
How to show Overlays in Power BI:
- Open or create a Power BI project that has a web connection to Neighborhoods of a project session. See this How-to;
- Select the visuals tab in your Power BI Project
- Click on the triple dots icon named "Get More Visuals" and select the option "Get More Visuals".
- In the search field, type "Icon" and select the "Icon Maps" app.
- On the Icon Map app page, click on the "Add" button.
- Unfold the "Neighborhoods" data connection
- Find and drag the features.properties.LONGITUDE and LATITUDE attributes to the corresponding Longitude and Latitude fields in the visual tab
- Find and drag the features.properties.NAME attribute to the Category field.
- Select a numerical property, such as feature.properties.ACTIVE and drag it to the Size field.
- The Icon Map should now show the neighborhoods center locations.
- Select the Format your visual tab and unfold the WMS Layer section.
- Click on the Off button to activate it.
- Switch to the Tygron Client Application to obtain the WMS Endpoint Url.
- Select Tools in the Ribbon bar
- Hover over API Overview and select Show WMS Endpoint. A Web browser opens.
- Copy the url stated in the OnlineResource element of the Service element.
- Switch back to the WMS Layer section of the icon map in Power BI.
- Paste the URL in the WMS URL field.
- Select the layer field and type 1. (This is the ID number for the Neighborhoods overlay)
- The Neighborhoods Overlay should now be visualized in the Icon Map.
-
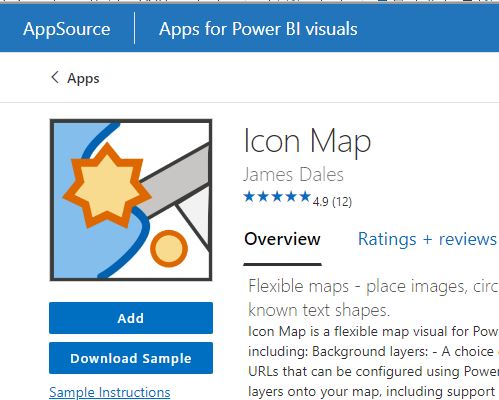 Icon Map app page in Power BI app store.
 -
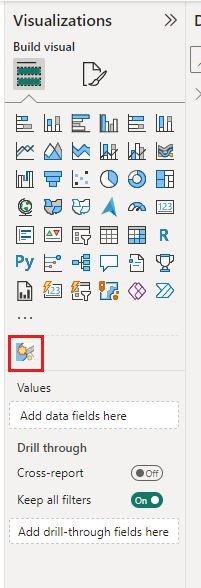 Icon Map visual button.
 -
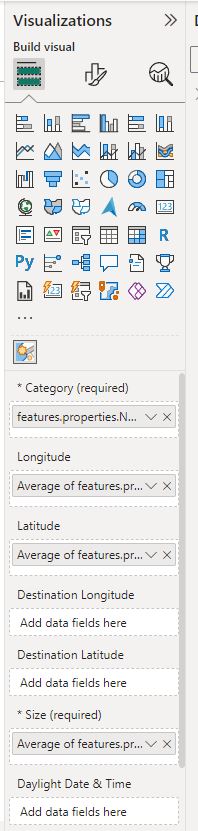 Icon Map configuration for Neighborhoods visualized as center points.
 -
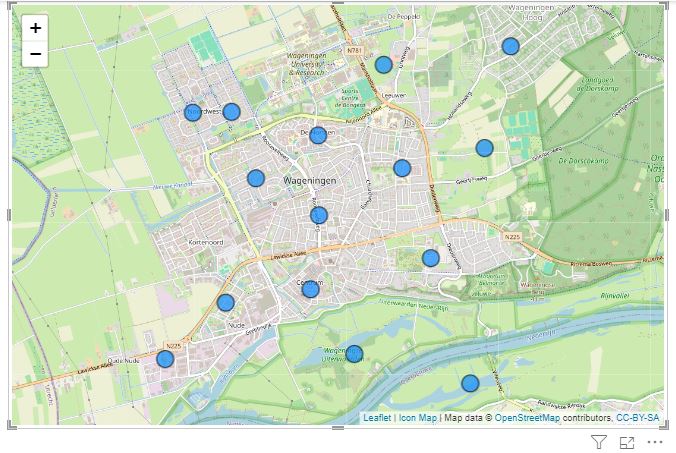 Icon Map with Neighborhoods visualized as center points.
 -
 Location in the Editor of the WMS Endpoint.
 -
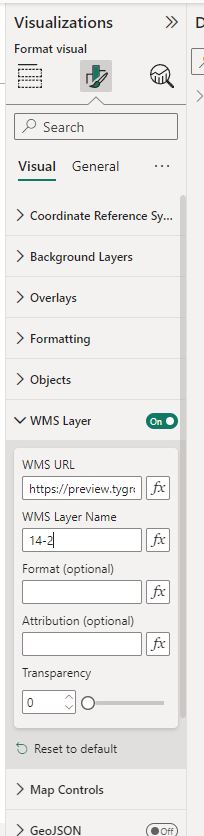 Icon Map Format Visual WMS Section with Overlay timeframe layer.
 -
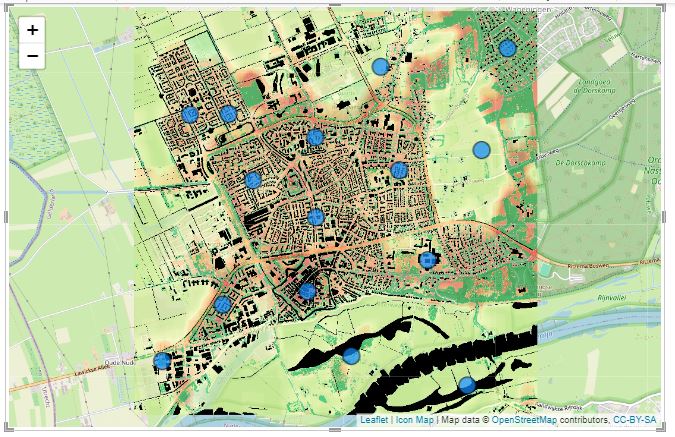 Icon Map Heat stress Overlay timeframe 2.
 -
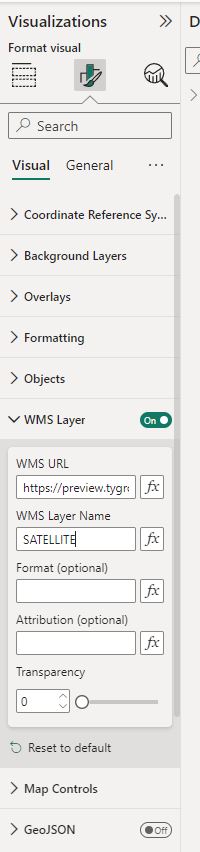 Icon Map Format Visual WMS Section with Satellite layer.
 -
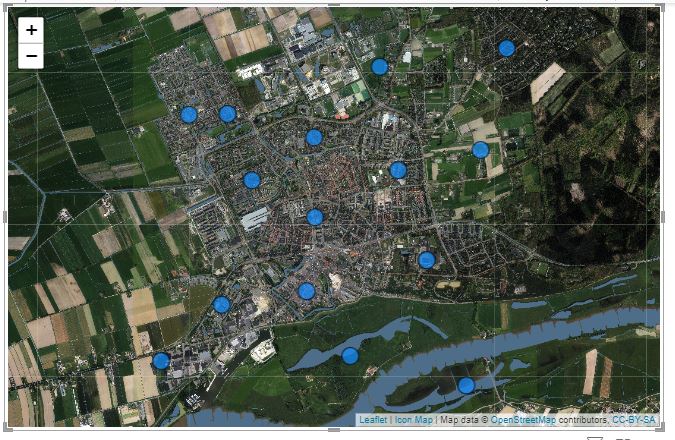 Icon Map Satellite Layer.


Notes
- Instead of an Overlay ID number, you can also use the WMS background layers.
- To access a different timeframe for an Overlay, type the Overlay ID followed by a dash and then the timeframe number. For example: 14-3, 10-0 or 3-99.
How-to's
- How to access your project data in Power BI
- How to show Indicator results in Power BI
- How to show polygon data in Power BI