How to show polygon data in Power BI
Jump to navigation
Jump to search
Editor → Current Situation (Ribbon tab) → Administrative (Ribbon bar) → Show Neighborhoods (Dropdown)
How to show polygon data in Power BI:
- Open or create a Power BI project that has a web connection to Neighborhoods of a project session. See this How-to;
- Select the visuals tab in your Power BI Project
- Click on the triple dots icon named "Get More Visuals" and select the option "Get More Visuals".
- In the search field, type "Icon" and select the "Icon Maps" app.
- On the Icon Map app page, click on the "Add" button.
- Unfold the "Neighborhoods" data connection
- Find and drag the features.properties.NAME attribute to the Category field.
- Select a numerical property, such as feature.properties.ACTIVE and drag it to the Size field.
- The Icon Map should now show a map, but not yet the shapes of the neighborhoods.
- Select the "Format your visual" tab and unfold the GeoJSON section.
- Click on the Off button to activate it.
- Switch to the Tygron Client Application to a Neighborhood GeoJSON endpoint.
- Select Current Situation in the Ribbon bar
- Hover over Administrative and under Neighborhoods, select Export Geo data.
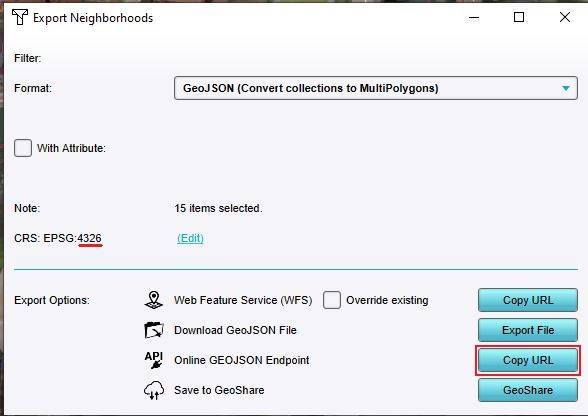
- In the Export Geo Data panel, set the type to GeoJSON (MultiPolygons).
- Verify that the export CRS is set to 4326. If not, click on the edit link.
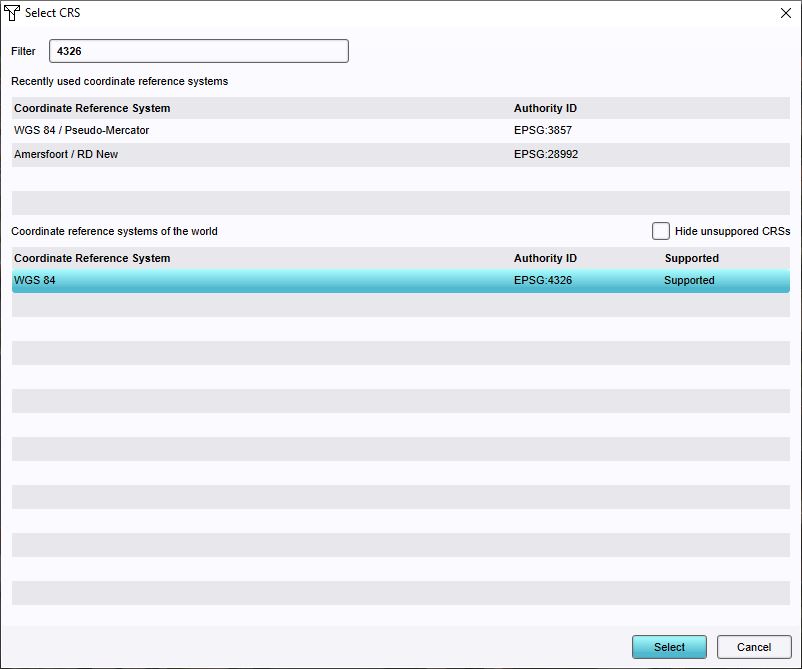
- In the CRS selection panel, type 4326 and press enter.
- Wait for the process to finish and select the WGS84 CRS with the number 4326 and confirm with select.
- Click on the Copy URL button next to GeoJSON endpoint.
- Switch back to Power BI and paste the link in the URL field in the GeoJSON we had previously activated. (Use CTRL-V)
-
Icon Map app page in Power BI app store
-
Icon Map visual button
-
Icon Map configuration for Neighborhoods
-
WGS 84 CRS selection
-
Export panel for neighborhoods
-
Icon Map Format Visual GeoJSON section
-
Icon Map Visualization
Notes

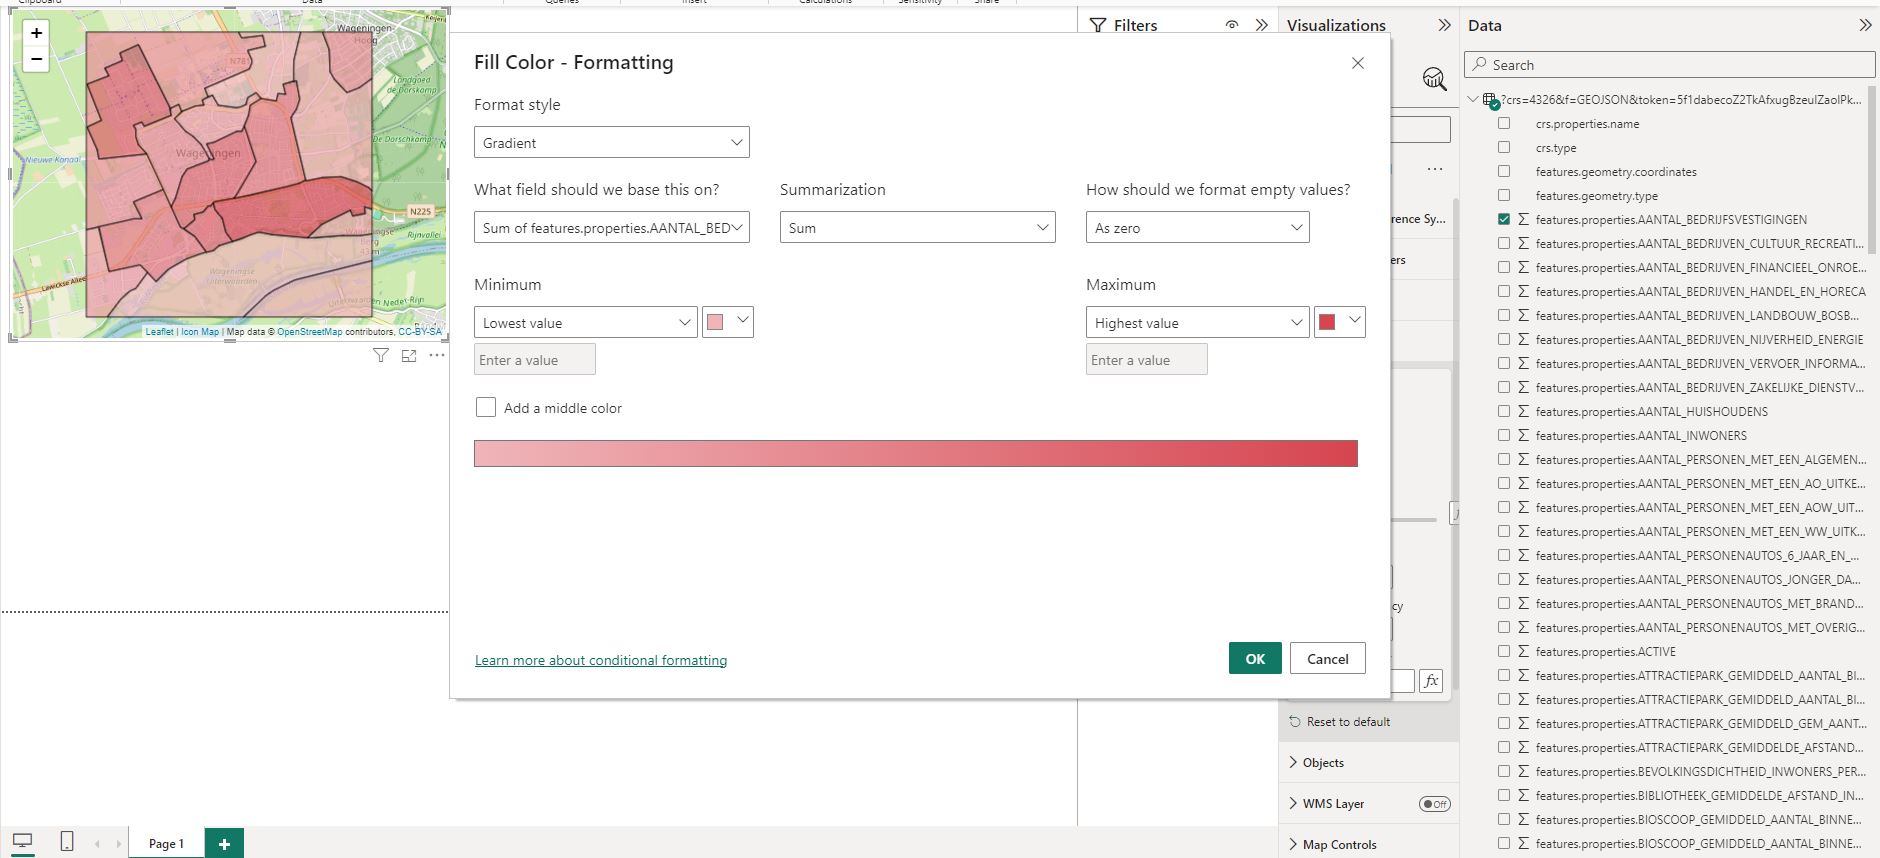
- In the format section of Format your Visuals, you can also customize the coloring of the shapes based on the value of a feature property.
- Icon Maps currently only seem to be able to visualize GeoJSONs exported using the CRS 4326.
How-to's
- How to access your project data in Power BI
- How to show Indicator results in Power BI
- How to show Overlays in Power BI

