How to edit Indicator properties

Stakeholder

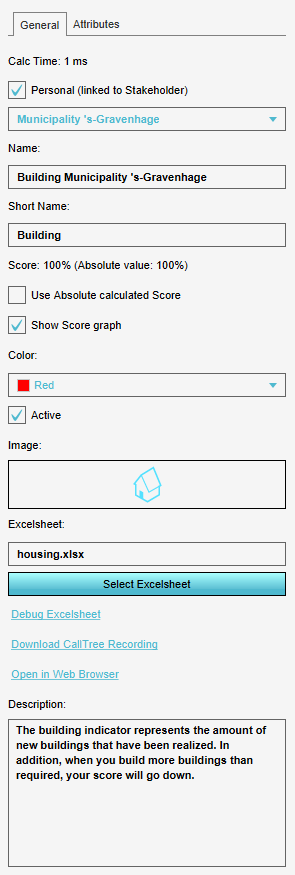
- The stakeholder of the Indicator. Stakeholder-specific Indicators have a connection with a single stakeholder. When editing a stakeholder-specific Indicator, you can change this by selecting a different stakeholder from the dropdown menu.
Name

- The full name of the Indicator. This is the name that will appear as the title of the Indicator in the project. You can change this by altering the text in the "Name" field.
Short name

- The short name of the Indicator. This will appear in areas where multiple indicators are summed up. You can change this by altering the text in the "Short name" field.
Absolute score

If the checkbox for absolute score is checked, the absolute score of the Indicator is used. The score is a value between 0 and 100%. What exactly 0% is, is adjustable with this checkbox. If the checkbox is not checked, 0% is the state of the current situation. The Indicator therefore always starts at 0. If you make changes to the current situation by demolishing or constructing Buildings, a new score is calculated based on the impact of the changes to the current situation. If you use the absolute score, a score is already calculated for the current situation, therefore the Indicator can already have a value of for example 60%. By making changes to the current situation, the score changes. Here the 0% is thus defined by the formulas in the excelsheet of the Indicator.
Graph

If the checkbox for show score graph is checked, the score graph is visible in the Indicator panel. If the checkbox is unchecked, the score graph is not visible. By leaving the text in the description box empty, the full space in the indicator panel can be used for example for showing the output of an Excel indicator.
Color

- The color of the indicator. The color will be used to display the indicator in graphs and charts. You can change this selecting the color field. A panel will appear in which you can specify the desired color.
Active

- Whether the Indicator is active. Inactive Indicators remain connected to stakeholders, but are unseen and have no effect. You will most likely want this checkbox checked. Toggle between the Indicator being active and inactive by clicking the check box.
Image

- The Indicator image, as displayed on the top bar, next to the Indicator progression bar. It is possible to upload a custom image to the Tygron Platform. This image has to be uploaded as a .png file, and has to be exactly 39 x 39 pixels small.
Excelsheet

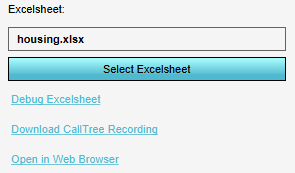
- The Excelsheet section showes which Excelsheet is active for the specific Indicator. The Select Excelsheet button opens an overview panel of all the Excelsheets in the project. The Debug Excelsheet and CallTree Recordings can be used for debugging the Excelsheet. This is mostly done when an error messages appears about the Excelsheet. The Open in Web Browser link displays the target and score of the indicator in a seperate web page.
Description

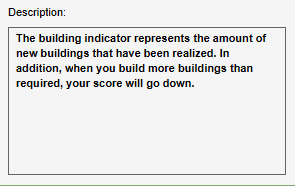
- The description of the Indicator. Most Indicators have a default description, but by customizing this text it is possible to guide the users towards specific actions, provide hints or refer to other sources of information. You can change this by altering the text in the "Description" area.