Green (Indicator): Difference between revisions
mNo edit summary |
No edit summary |
||
| (44 intermediate revisions by 6 users not shown) | |||
| Line 1: | Line 1: | ||
The green indicator calculates the amount of nature and green constructions in a neighborhood. The indicator then relates this to the amount of houses in the area. A target can be set for the amount of green per house. | |||
This indicator is useful for projects where for example: | |||
* livability is an important aspect in the project | |||
* the project area should become climate adaptive | |||
* compensation in the form of green is required for new housing projects | |||
This Excel indicator can be downloaded from the Public [[GeoShare]]. Read on to find out more about the indicator's calculation method and how to set it up in your project. | |||
Green | : ''Note: this indicator is the same as the default Green indicator from the Indicator menu in the {{software}}.'' | ||
== | ===Indicator panel=== | ||
[[File: | [[File:Indicator_panel_green.JPG|400px|right]] | ||
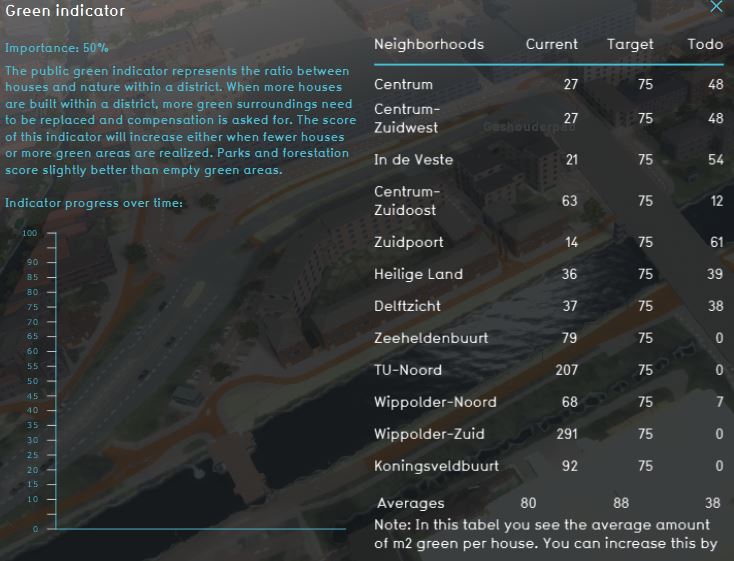
The | The indicator panel shows per neighborhood: | ||
* the neighborhood name | |||
* the current amount of green (m2) in the neighborhood | |||
* the target amount of green (m2) for the neighborhood | |||
* how much green in (m2) per neighborhood should be build | |||
===Calculation=== | |||
The green indicator calculates the amount of houses and the amount of open green space and green functions. | |||
Open green space means: | |||
* Unbuilt [[Terrain#Surface|dunes]] | |||
* Unbuilt [[Terrain#Surface|open land]] | |||
* Unbuilt [[Terrain#Surface|grassland]] | |||
Green functions are functions such as houses with a green roof or a city park for example. These functions all have a value for the [[Vegetation fraction (Function Value)|vegetation fraction]]. | |||
The green | The amount of open green space and green functions added together is the amount of green. | ||
The indicator scores based on how much green in m² exists per house and relates this to the set target. | |||
According to <ref name="clo"/>, there is no norm for the amount of green per house, but 75 m2 can be used as a guideline. | |||
The more green in the project, the better the indicator scores. | |||
A project with less houses will require less green than a project with lots of houses. | |||
===Score=== | |||
The score is represented in a progress bar, with a scale from 0 to 100%. | |||
Determine if you want to calculate the [[Indicators#Absolute_score|absolute or relative score]]. | |||
==Additional configurations== | |||
For this indicator to function, a [[Global|Global]] to set the target has to be defined. Read below for the steps. | |||
===Configuration by adding the Global (Index)=== | |||
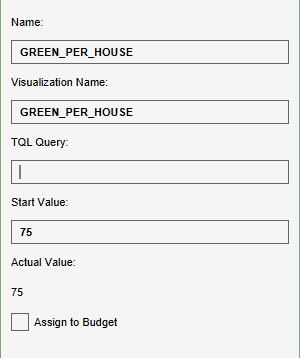
The target for the amount of green in m2 per house is set in a [[Global|Global]]. | |||
{{Editor steps|title=|Select ''Current Situation'' and then hover over ''TQL Queries'' in the ribbon header| Click on ''Add Global'' in the hover panel. A new global named VARIABLE will be added to the left panel.| Select the global VARIABLE.| In the right panel, change the name to GREEN_PER_HOUSE| Change the start value to a number representing the amount of green in m2 per house| Hover over the Auto update icon and choose for Reset to Start values (faster) to update your project.}} | |||
<gallery mode=nolines> | |||
File:Add_global_new_interface.JPG | |||
File:Global_green.JPG | |||
File:Recalculate_excel.JPG | |||
</gallery> | |||
===Configuration by using the Platform Indicator=== | |||
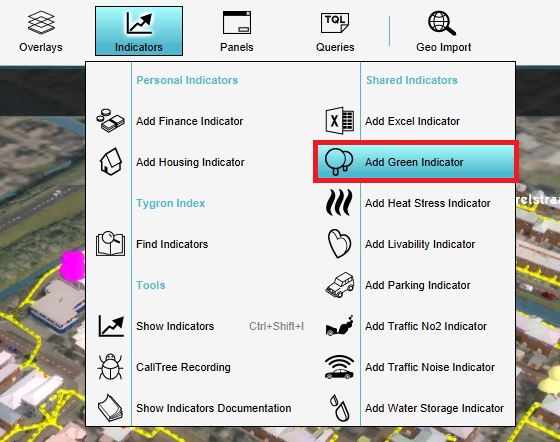
It is also possible to use the Green Indicator from the platform, this indicator can be adjusted in the bottom panel of the interface. The value is linked to the indicator target and by adjusting this value the target is also adjusted. | |||
{{Editor location|Indicators}} | |||
[[File:Green indicator.JPG|150px|]] | |||
[[File:Green indicators bottom panel.jpg|500px|]] | |||
{{article end | |||
|references= | |||
<references> | |||
<ref name="clo">(2010). Beschikbaarheid groen in de stad, 2000 - 2006. https://www.clo.nl/indicatoren/nl029906-beschikbaarheid-van-groen-in-de-stad</ref> | |||
</references> | |||
}} | |||
{{Indicator nav}} | |||
[[Category:Public GeoShare]] | |||
Latest revision as of 12:28, 22 September 2023
The green indicator calculates the amount of nature and green constructions in a neighborhood. The indicator then relates this to the amount of houses in the area. A target can be set for the amount of green per house. This indicator is useful for projects where for example:
- livability is an important aspect in the project
- the project area should become climate adaptive
- compensation in the form of green is required for new housing projects
This Excel indicator can be downloaded from the Public GeoShare. Read on to find out more about the indicator's calculation method and how to set it up in your project.
- Note: this indicator is the same as the default Green indicator from the Indicator menu in the Tygron Platform.
Indicator panel
The indicator panel shows per neighborhood:
- the neighborhood name
- the current amount of green (m2) in the neighborhood
- the target amount of green (m2) for the neighborhood
- how much green in (m2) per neighborhood should be build
Calculation
The green indicator calculates the amount of houses and the amount of open green space and green functions. Open green space means:
Green functions are functions such as houses with a green roof or a city park for example. These functions all have a value for the vegetation fraction. The amount of open green space and green functions added together is the amount of green.
The indicator scores based on how much green in m² exists per house and relates this to the set target. According to [1], there is no norm for the amount of green per house, but 75 m2 can be used as a guideline.
The more green in the project, the better the indicator scores. A project with less houses will require less green than a project with lots of houses.
Score
The score is represented in a progress bar, with a scale from 0 to 100%. Determine if you want to calculate the absolute or relative score.
Additional configurations
For this indicator to function, a Global to set the target has to be defined. Read below for the steps.
Configuration by adding the Global (Index)
The target for the amount of green in m2 per house is set in a Global.
- Select Current Situation and then hover over TQL Queries in the ribbon header
- Click on Add Global in the hover panel. A new global named VARIABLE will be added to the left panel.
- Select the global VARIABLE.
- In the right panel, change the name to GREEN_PER_HOUSE
- Change the start value to a number representing the amount of green in m2 per house
- Hover over the Auto update icon and choose for Reset to Start values (faster) to update your project.
Configuration by using the Platform Indicator
It is also possible to use the Green Indicator from the platform, this indicator can be adjusted in the bottom panel of the interface. The value is linked to the indicator target and by adjusting this value the target is also adjusted.
References
- ↑ (2010). Beschikbaarheid groen in de stad, 2000 - 2006. https://www.clo.nl/indicatoren/nl029906-beschikbaarheid-van-groen-in-de-stad


