Risk contour (Indicator)
The risk contour indicator calculates the number of houses that lie in a zone around a hazardous Building and the houses that are outside this contour and therefore "safe". The indicator calculates a risk score per neighborhood based on this ratio. The zones around dangerous buildings are visible in the Safety Distance Overlay. This overlay combines information from Risicokaart (to know where hazardous buildings are, for example a LPG station) with their adjustable contour. This indicator is useful for projects in which (for example):
- Livability is an important aspect of the project
- The project is in an area with a lot of industry
This Excel indicator can be downloaded from the Public GeoShare. Read on to find out more about the indicator's calculation method and how to set it up in your project.
Indicator panel

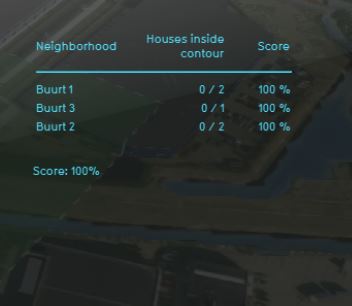
The indicator panel (see the image on the right) shows in a table per neighborhood:
- the neighborhood name
- the number of houses in the dangerous zone/ total number of houses
- the calculated risk score
Calculation
The risk score is a percentage calculated by firstly retrieving the number of houses in the dangerous contour subtracted from the total number of houses in the neighborhood. Then the number of safe houses is divided from the overall number of houses for that neighborhood.
Score
The score is represented in a progress bar, with a scale from 0 to 100%. Determine if you want to calculate the absolute or relative score. The more houses are located in a zone around a dangerous building per neighborhood, the lower the score and the more risk there is.
Additional configurations
For this indicator, the Safety Distance Overlay has to be added to the project. See below for the steps.