Power BI: Difference between revisions
Jump to navigation
Jump to search
No edit summary |
No edit summary |
||
| (14 intermediate revisions by 3 users not shown) | |||
| Line 1: | Line 1: | ||
Microsoft | Microsoft Power BI{{ref|PowerBI}} is an interactive data visualization software product developed by Microsoft with a primary focus on business intelligence. | ||
Power BI has a desktop application and a cloud environment. Projects from the desktop applications can be published as reports on the Power BI cloud environment. Reports on the Power BI cloud environment can be made public. | Power BI has a desktop application and a cloud environment. Projects from the desktop applications can be published as reports on the Power BI cloud environment. Reports on the Power BI cloud environment can be made public. | ||
{{gallery | |||
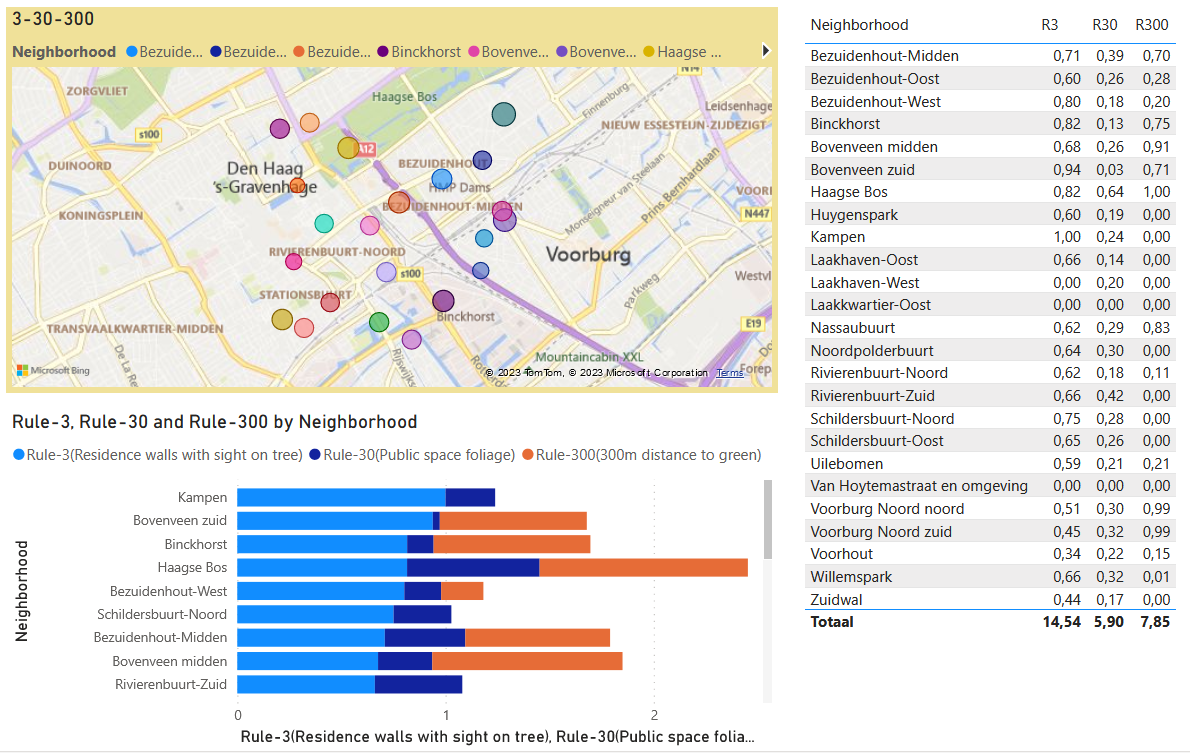
[ | |PowerBI_example1.png|Live [[session]] connection with {{software}} 1 | ||
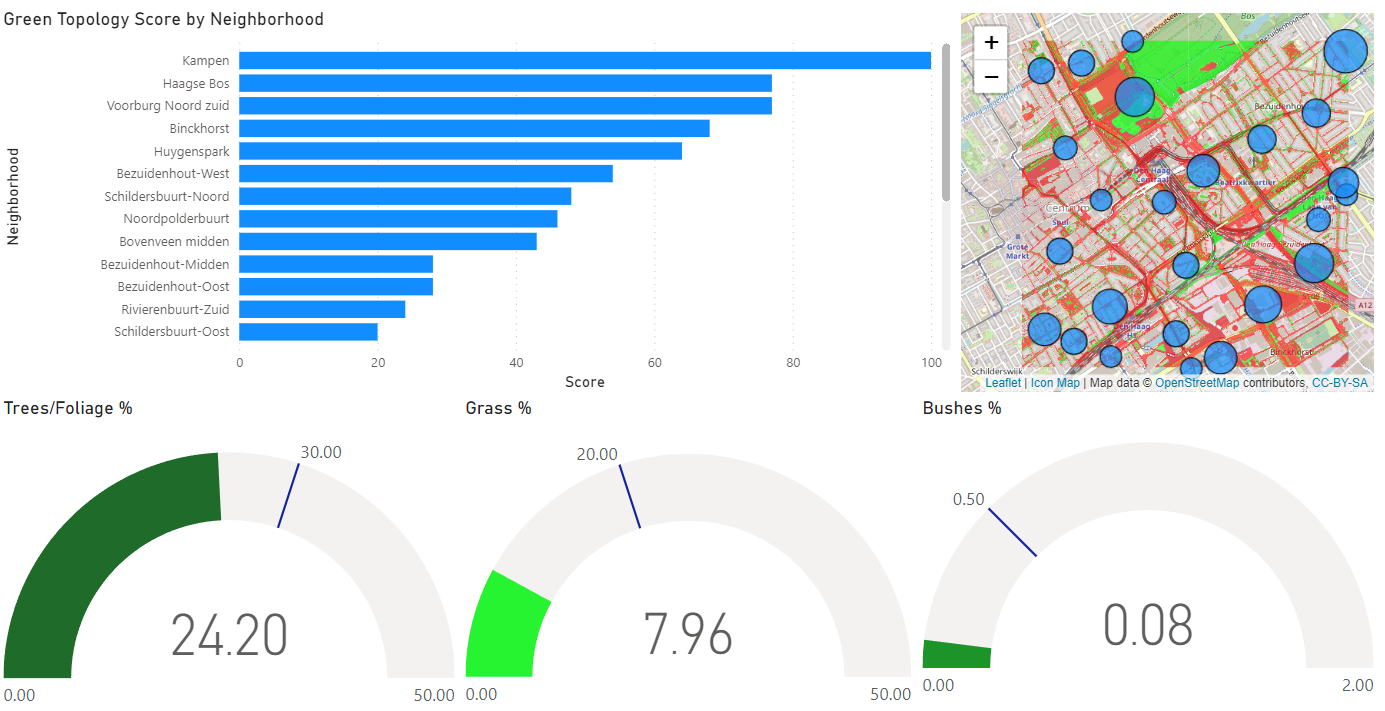
|PowerBI_example2.png|Live [[session]] connection with {{software}} 2 | |||
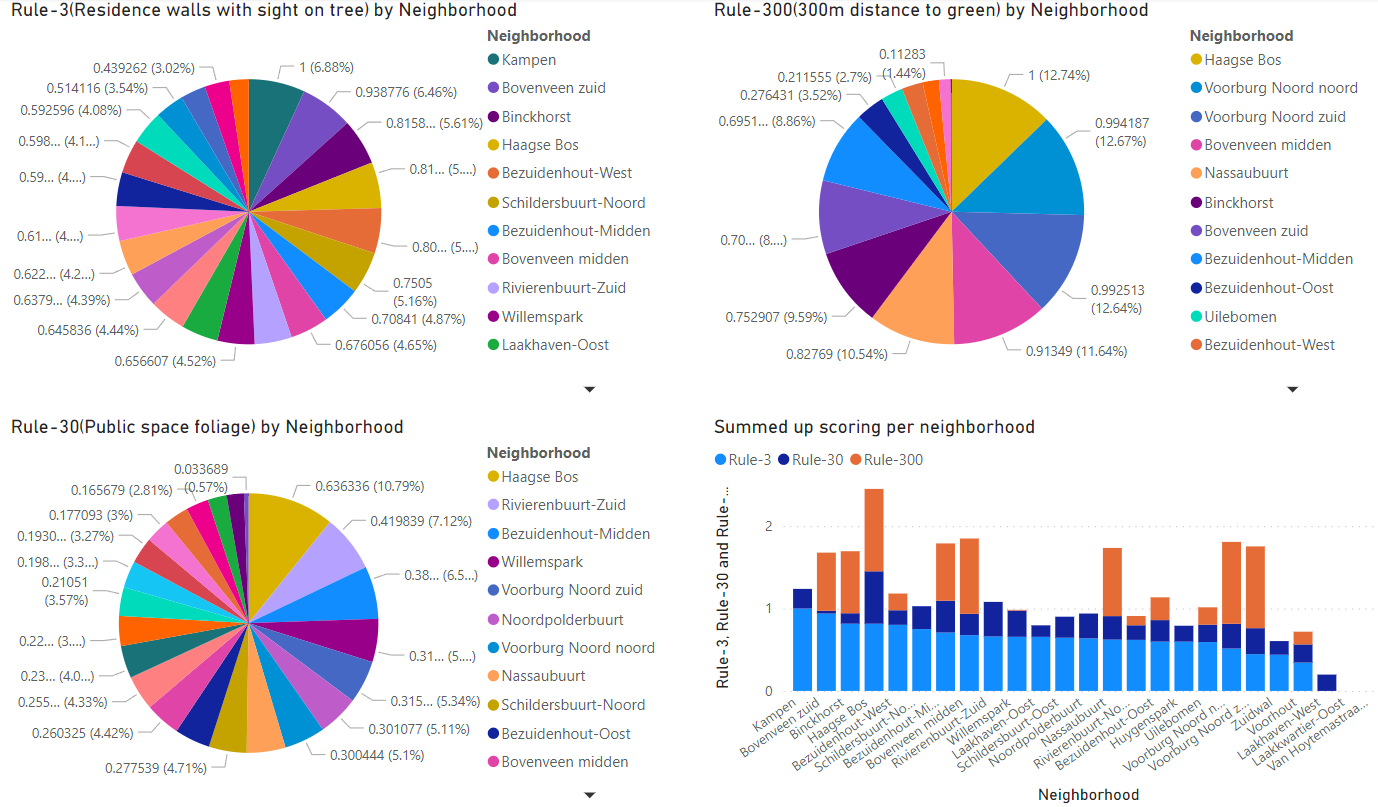
|PowerBI_example3.png|Live [[session]] connection with {{software}} 3 | |||
|PowerBI_Bar_Chart.png|[[How to access your project data in Power BI|Bar chart of Neighborhood data using a Web Connection]] | |||
|Icon_Map_WMS_timeframe.JPG|[[How to show Overlays in Power BI|Overlay with timeframe using Icon Maps]] | |||
|Icon_Map_GeoJSON_gradient.jpg|[[How to show polygon data in Power BI|Neighborhood polygon data using Icon Maps]] | |||
}} | |||
{{article end | {{article end | ||
|howtos= | |howtos= | ||
* [[How to access your project data in Power BI]] | * [[How to access your project data in Power BI]] | ||
* [[How to show Indicator results in Power BI]] | * [[How to show Indicator results in Power BI]] | ||
* [[How to show Overlays in Power BI]] | |||
* [[How to show polygon data in Power BI]] | |||
|external= | |||
* Example Power BI report based on a keep alive project: https://app.powerbi.com/view?r=eyJrIjoiNjA3YjM3ZGYtNWIwZi00NDg2LTlhNzUtMzVjMjU0OWViZjYwIiwidCI6ImIxMjI2NjgwLWViOTYtNGM2Mi05ZWU4LWYyYjQ0NzUzYjQxNCIsImMiOjl9 | |||
|references= | |||
<references> | |||
{{ref|PowerBI | |||
|name=Power BI | |||
|author= | |||
|page= | |||
|source= | |||
|link=https://www.microsoft.com/en-us/power-platform/products/power-bi/ | |||
|lastvisit=2024-11-17 | |||
}} | |||
</references> | |||
}} | }} | ||
{{GeoDataOverview}} | |||
Latest revision as of 16:15, 14 December 2023
Microsoft Power BI[1] is an interactive data visualization software product developed by Microsoft with a primary focus on business intelligence.
Power BI has a desktop application and a cloud environment. Projects from the desktop applications can be published as reports on the Power BI cloud environment. Reports on the Power BI cloud environment can be made public.
How-to's
- How to access your project data in Power BI
- How to show Indicator results in Power BI
- How to show Overlays in Power BI
- How to show polygon data in Power BI
External links
- Example Power BI report based on a keep alive project: https://app.powerbi.com/view?r=eyJrIjoiNjA3YjM3ZGYtNWIwZi00NDg2LTlhNzUtMzVjMjU0OWViZjYwIiwidCI6ImIxMjI2NjgwLWViOTYtNGM2Mi05ZWU4LWYyYjQ0NzUzYjQxNCIsImMiOjl9
References
- ↑ Power BI ∙ Found at: https://www.microsoft.com/en-us/power-platform/products/power-bi/ ∙ (last visited: 2024-11-17)


