Network Overview Overlay: Difference between revisions
Jump to navigation
Jump to search
No edit summary |
|||
| (One intermediate revision by one other user not shown) | |||
| Line 1: | Line 1: | ||
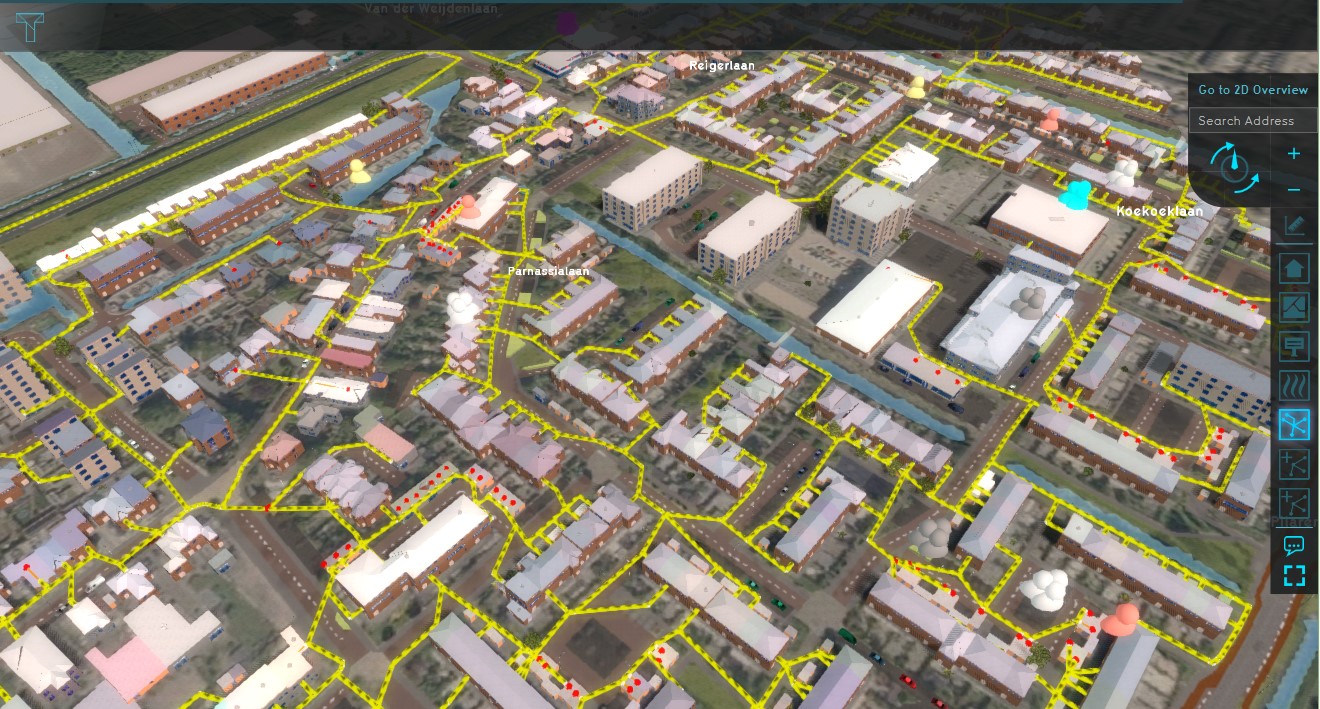
Network Overview | [[File:Network Overview.jpg|thumb|400px|right|An example of a Network Overview]] | ||
The | The Network Overview Overlay shows the current state of buildings connected to a network. A network consists of two types of users: consumers and producers and there are three network states. | ||
{| class="wikitable" | {| class="wikitable" | ||
| Line 25: | Line 25: | ||
==Additional information displayed in hover panel== | ==Additional information displayed in hover panel== | ||
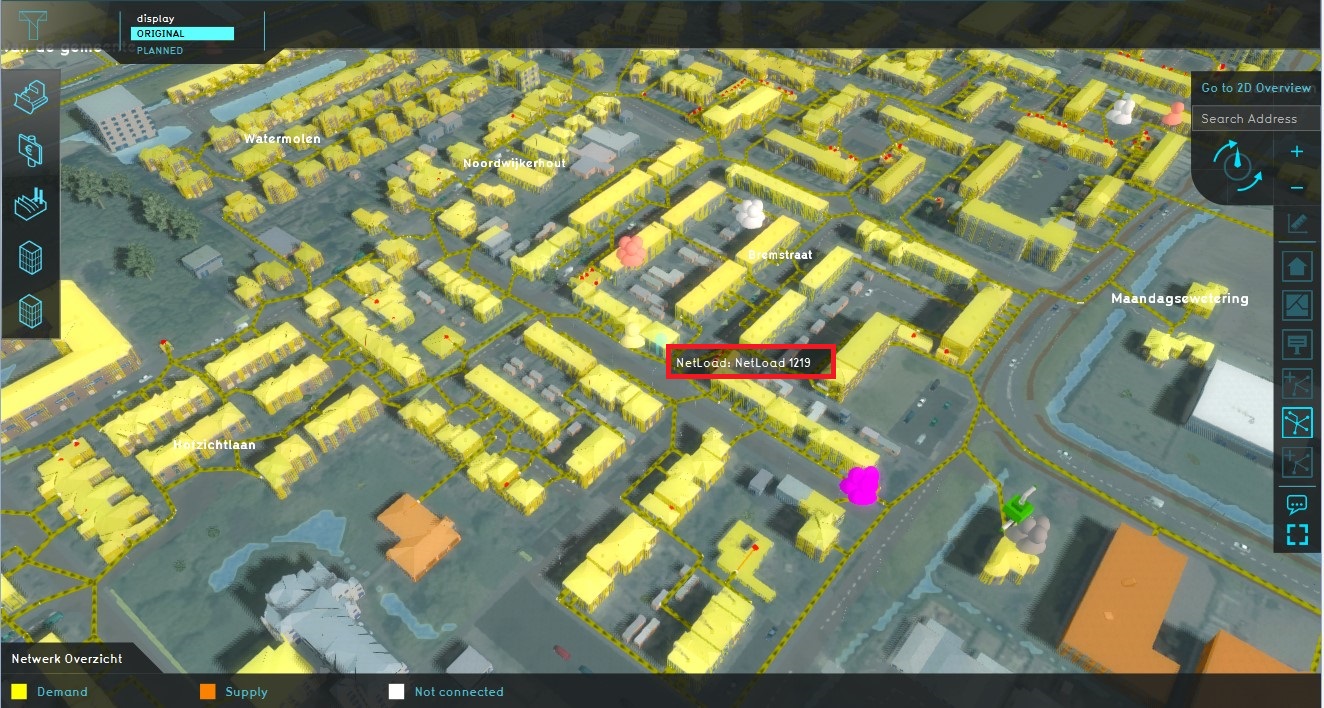
[[File:Hover_panel_network_overview2.jpg|thumb|450px|right|The hover showing the Net load of the selected building]] | [[File:Hover_panel_network_overview2.jpg|thumb|450px|right|The hover showing the Net load of the selected building]] | ||
When clicking on a connected building on the map, the hover panel will show the | When clicking on a connected building on the map, the hover panel will show the name of the Net load of the selected building. | ||
==How-to's== | ==How-to's== | ||
[[How to add and remove an Overlay]] | * [[How to add and remove an Overlay]] | ||
==Notes== | |||
* Select the active Network in the right panel of the Overlay. | |||
==See also== | ==See also== | ||
Latest revision as of 12:55, 21 September 2020

The Network Overview Overlay shows the current state of buildings connected to a network. A network consists of two types of users: consumers and producers and there are three network states.
| Network Status | Color | Net Load |
|---|---|---|
| Demand | Yellow | Consumer |
| Supply | Orange | Producer |
| Not connected | White | No load |
Additional information displayed in hover panel

When clicking on a connected building on the map, the hover panel will show the name of the Net load of the selected building.
How-to's
Notes
- Select the active Network in the right panel of the Overlay.
See also