Solar panels (Indicator): Difference between revisions
Created page with "{{learned|what the solar panels indicator is|how the solar panels indicator is calculated|how to adjust your project in order to make the indicator functional}} ==General== =..." |
No edit summary |
||
| (29 intermediate revisions by 5 users not shown) | |||
| Line 1: | Line 1: | ||
The solar panels indicator calculates the number of houses with solar panels in the current and planned situation and relates this to the defined targets. The indicator focuses on three housing categories: top market, market and affordable housing. For each housing category a different target (percentage) for the amount of houses in the category where it is desirable to have solar panels can be set. For example, a percentage of 50% for all top market housing translates to a goal of at least half of the houses in the top market sector with solar panels. The targets are on neighborhood level and are adjustable which makes the indicator scalable and suitable for different types of projects. | |||
This indicator is useful for projects where for example: | This indicator is useful for projects where for example: | ||
* one of the goals is to work on reaching a certain | * (one of the) goals is to work on reaching a certain renewable energy target | ||
* different spatial plans are compared | * different spatial plans are compared using the [[3D Visualization]] | ||
* the project area should become climate adaptive | |||
This Excel indicator can be downloaded from the Public [[GeoShare]]. Read on to find out more about the indicator's calculation method and how to set it up in your project. | |||
===Indicator panel=== | ===Indicator panel=== | ||
[[File: | [[File:Indicator_panel_sun.JPG|300px|right]] | ||
The indicator panel shows the | The indicator panel shows per neighborhood: | ||
* the neighborhood name | |||
* the percentage of houses with solar panels in the top market sector | |||
* the percentage of houses with solar panels in the market sector | |||
* the percentage of houses with solar panels in the affordable sector | |||
===Calculation=== | ===Calculation=== | ||
The indicator calculates the difference in houses between the planned and | The indicator calculates the difference in houses between the planned (future design) and current state of the project. Houses in the {{software}} referred to as units. A building block is not necessarily one unit. You can see the number of units when clicking on a [[building]] in the [[3D Visualization]]. | ||
Only units of the type | Only units of the type top market, market and affordable housing are being taken into account. | ||
By default, houses in the {{software}} do not have solar panels. By editing the [[Buildings]] (possibly also in the current) and maquette situation, a score can be calculated. | |||
===Score=== | ===Score=== | ||
The score is represented in a progress bar, with a scale from 0 to 100%. | The score is represented in a progress bar, with a scale from 0 to 100%. | ||
Determine if you want to calculate the [[Indicators#Absolute_score|absolute or relative score]]. | Determine if you want to calculate the [[Indicators#Absolute_score|absolute or relative score]]. | ||
The score is calculated by looking per neighborhood per housing category to what extent the set targets are met. These scores are averaged for all neighborhoods and averaged to one final percentage, which is the final score. | |||
==Additional configurations== | ==Additional configurations== | ||
For this indicator to function, | For this indicator to function, three globals to set the targets have to be defined. Read below for the steps. | ||
===Add the | ===Add the Globals=== | ||
The | The targets for the amount of houses that should have solar panels for the three different housing categories are set in three different [[Global]]s. To learn more about what a global is, please go to the [[Global]]s page. | ||
{{Editor steps|title=|Select '' | {{Editor steps|title=|Select ''Current Situation'' and then hover over ''TQL Queries'' in the ribbon header| Click on ''Add Global'' in the hover panel. A new global named VARIABLE will be added to the left panel.| Select the global VARIABLE.| In the right panel, change the name to TARGET_TOPMARKET_SOLARPANELS| Change the start value to a number representing the percentage of houses that should have solar panels.|Repeat steps 2 to 5 for the targets TARGET_MARKET_SOLARPANELS and TARGET_AFFORDABLE_SOLARPANELS and fill in their values| Hover over the Auto update icon and choose for Reset to Start values (faster) to update your project.}} | ||
<gallery mode=nolines> | <gallery mode=nolines> | ||
File: | File:Add_global_new_interface.JPG | ||
File: | File:Set_globals_solar_panels.JPG | ||
File:Recalculate_excel.JPG | |||
</gallery> | </gallery> | ||
{{Indicator nav}} | |||
[[Category:Public GeoShare] | |||
Latest revision as of 16:08, 2 February 2023
The solar panels indicator calculates the number of houses with solar panels in the current and planned situation and relates this to the defined targets. The indicator focuses on three housing categories: top market, market and affordable housing. For each housing category a different target (percentage) for the amount of houses in the category where it is desirable to have solar panels can be set. For example, a percentage of 50% for all top market housing translates to a goal of at least half of the houses in the top market sector with solar panels. The targets are on neighborhood level and are adjustable which makes the indicator scalable and suitable for different types of projects.
This indicator is useful for projects where for example:
- (one of the) goals is to work on reaching a certain renewable energy target
- different spatial plans are compared using the 3D Visualization
- the project area should become climate adaptive
This Excel indicator can be downloaded from the Public GeoShare. Read on to find out more about the indicator's calculation method and how to set it up in your project.
Indicator panel

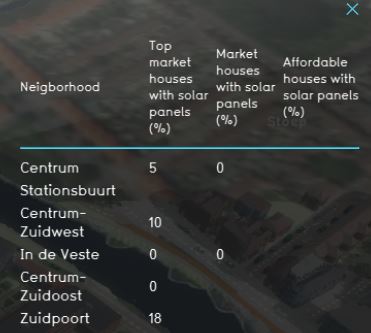
The indicator panel shows per neighborhood:
- the neighborhood name
- the percentage of houses with solar panels in the top market sector
- the percentage of houses with solar panels in the market sector
- the percentage of houses with solar panels in the affordable sector
Calculation
The indicator calculates the difference in houses between the planned (future design) and current state of the project. Houses in the Tygron Platform referred to as units. A building block is not necessarily one unit. You can see the number of units when clicking on a building in the 3D Visualization. Only units of the type top market, market and affordable housing are being taken into account.
By default, houses in the Tygron Platform do not have solar panels. By editing the Buildings (possibly also in the current) and maquette situation, a score can be calculated.
Score
The score is represented in a progress bar, with a scale from 0 to 100%. Determine if you want to calculate the absolute or relative score. The score is calculated by looking per neighborhood per housing category to what extent the set targets are met. These scores are averaged for all neighborhoods and averaged to one final percentage, which is the final score.
Additional configurations
For this indicator to function, three globals to set the targets have to be defined. Read below for the steps.
Add the Globals
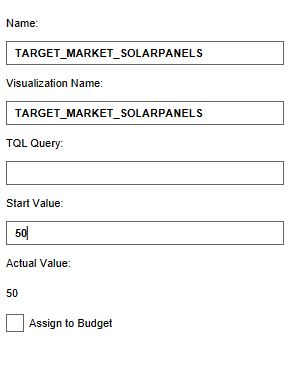
The targets for the amount of houses that should have solar panels for the three different housing categories are set in three different Globals. To learn more about what a global is, please go to the Globals page.
- Select Current Situation and then hover over TQL Queries in the ribbon header
- Click on Add Global in the hover panel. A new global named VARIABLE will be added to the left panel.
- Select the global VARIABLE.
- In the right panel, change the name to TARGET_TOPMARKET_SOLARPANELS
- Change the start value to a number representing the percentage of houses that should have solar panels.
- Repeat steps 2 to 5 for the targets TARGET_MARKET_SOLARPANELS and TARGET_AFFORDABLE_SOLARPANELS and fill in their values
- Hover over the Auto update icon and choose for Reset to Start values (faster) to update your project.
[[Category:Public GeoShare]
