Plotly
Jump to navigation
Jump to search

Plotly[1], is a free and open source library that lets you create and update figures, display them. Plotly functionality can be called via JavaScript in Panels and Indicators.
Plotly is automatically included as an import for html pages served by the Tygron Platform when Plotly (with a capital P) is used in content of that page.
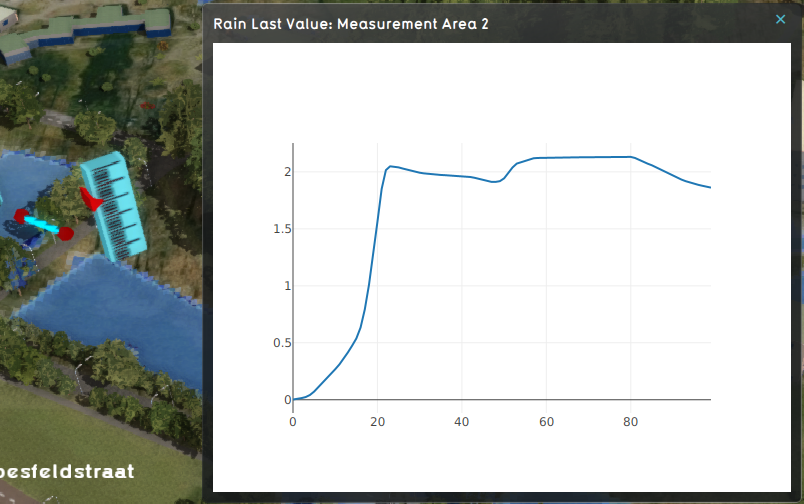
- A basic example of how to plot a grid overlay can be found, by first adding a "Panel → Add Text Template", then go to the panel text en select "(enlarge)", now select the "Insert TQL Plotly Graph" link.
- Another example Grid Overlay Area Measurement (Panel) for measurement graphs in an area.
How-to's
- How to measure area averages of a grid and visualize it in a graph
- How to plot neighborhood demographics in a pie chart
References
- ↑ Plotly ∙ Found at: https://plotly.com/javascript/ ∙ (last visited: 2025-05-12)