Height map: Difference between revisions
Jump to navigation
Jump to search
No edit summary |
mNo edit summary |
||
| (11 intermediate revisions by 2 users not shown) | |||
| Line 1: | Line 1: | ||
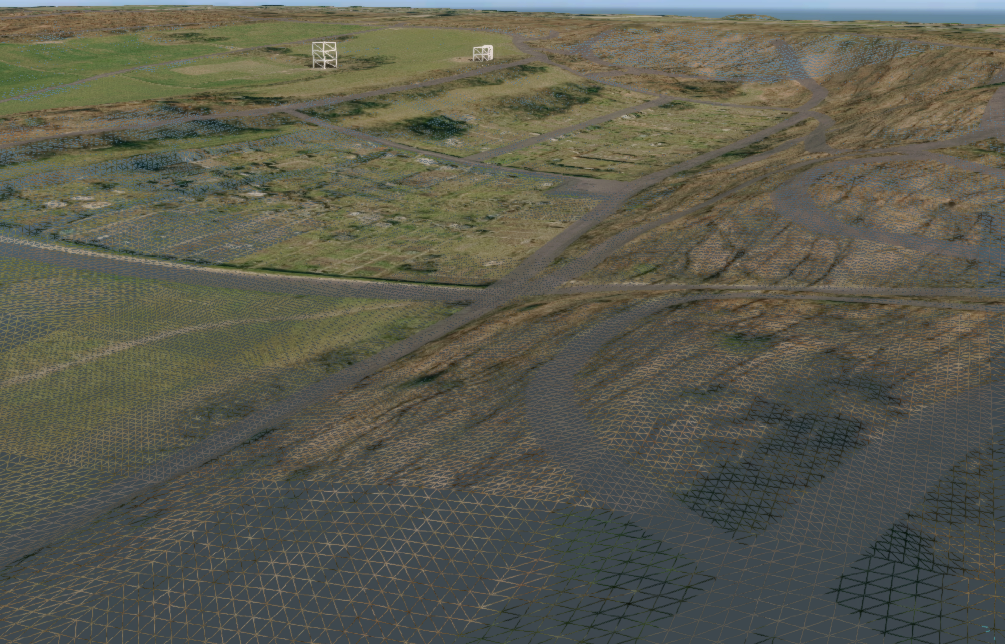
The height map is the visualization of the [[DTM]] in the [[3D Visualization]]. | [[File:tesselated_terrain_height.png|thumb|right|Terrain height visualized in the [[Tygron Client]] as Wireframe]]The height map is the visualization of the [[DTM]] in the [[3D Visualization]]. | ||
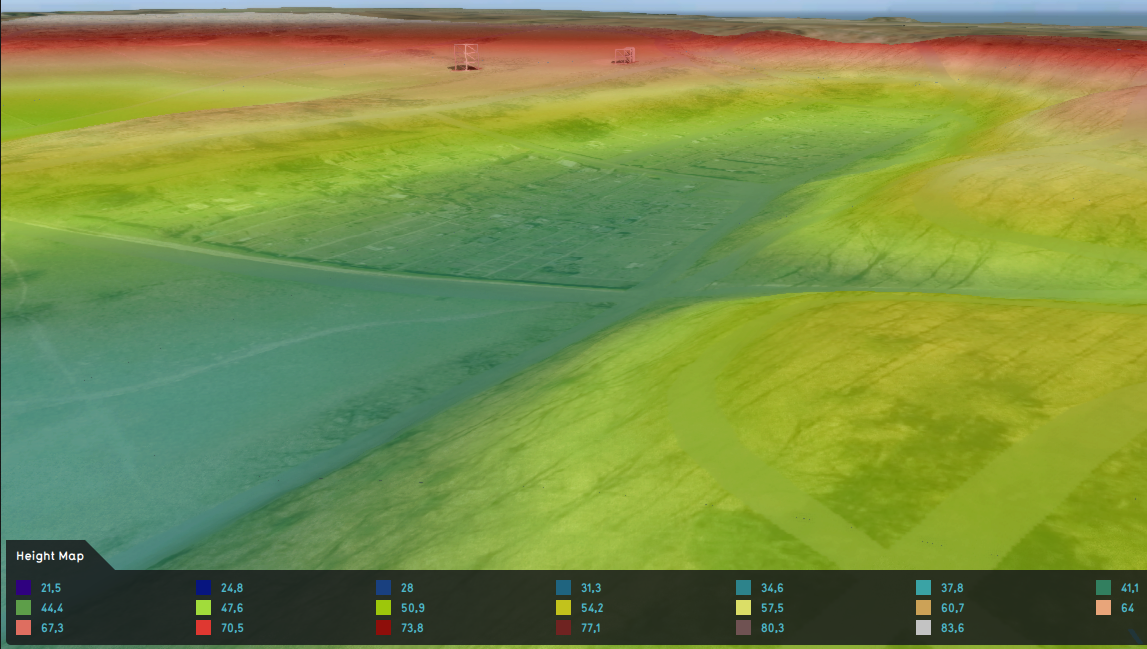
[[File:terrain_height_overlay.png|thumb|right|[[Heightmap (Overlay)|Terrain height overlay]] visualized in the [[Tygron Client]]]] | |||
The content of the height map is determined by the height data stored in [[Height Sector]] items. | The content of the height map is determined by the height data stored in [[Height Sector]] items. | ||
Height data is obtained from or adjusted with: | Height data is obtained from or adjusted with: | ||
| Line 17: | Line 17: | ||
{{article end | {{article end | ||
|seealso= | |seealso= | ||
* [[Height sector]]s | |||
* [[Heightmap (Overlay)]] | |||
* [[Elevation model]] | |||
* [[Elevation GeoTIFF]] | |||
* [[Satellite map]] | * [[Satellite map]] | ||
* [[Terrain]]s | * [[Terrain]]s | ||
* [[Grid Spatial]]s | |||
* [[TiffSpatial]]s | |||
|howtos= | |||
* [[How to import a GeoTIFF to change the elevation model]]. | |||
* [[How to adjust the height map with a Combo Overlay]] | |||
* [[How to remove a waterway from the heightmap]] | |||
* [[How to change heightmap based on vector data]] | |||
* [[How to create a heightmap for a new neighborhood]] | |||
}} | }} | ||
Latest revision as of 07:18, 9 October 2025

The height map is the visualization of the DTM in the 3D Visualization.

The content of the height map is determined by the height data stored in Height Sector items. Height data is obtained from or adjusted with:
- Project Sources on Height data:
- Project Sources#AHN: Height raster data in The Netherlands
- Terrain: A multi-resolution world elevation layer from ESRI
- More information on how these are combined can be found at Elevation model
- GeoTIFFs applied to the project area
- Levees, Measures with TiffSpatials or Lower land actions applied during a Test-run session.
The coloring of this height map is determined by:
- Satellite map, obtained from World Imagery
- Color values of present Buildings and Terrains
- Visualized selected Overlay in the Navigation panel