Livability Overlay: Difference between revisions
| Line 7: | Line 7: | ||
This overlay becomes available for each stakeholder with an [[Indicator_Weights|interest]] in the [[Livability_(Indicator)|livability indicator]]. In other words, the overlay is only visible when the livability indicator is also active for the selected stakeholder. | This overlay becomes available for each stakeholder with an [[Indicator_Weights|interest]] in the [[Livability_(Indicator)|livability indicator]]. In other words, the overlay is only visible when the livability indicator is also active for the selected stakeholder. | ||
== | ==Legend== | ||
*Green (Good): Indicates a good livability, compared to the surroundings. | *Green (Good): Indicates a good livability, compared to the surroundings. | ||
*Orange (Average): Indicates an average livability, compared to the surroundings. | *Orange (Average): Indicates an average livability, compared to the surroundings. | ||
Revision as of 09:35, 2 April 2019
What the Livability Overlay is

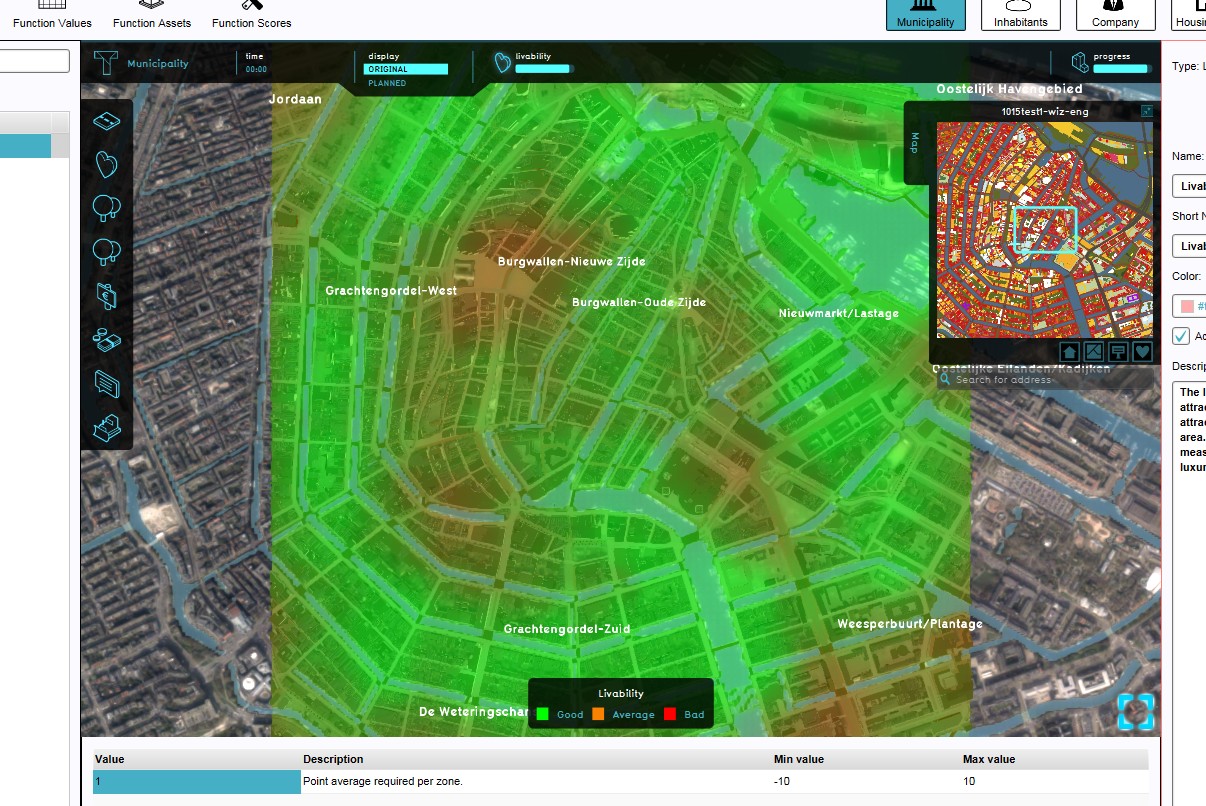
The Livability Overlay is an overlay which displays the average livability in different colors for the project area, indicating good, average and bad livability. Each object in the 3D World (function or land type) has a default specified livability effect, based on research. The average value of a location is the combined livability effect values of the surrounding functions in a 200m radius.
This overlay becomes available for each stakeholder with an interest in the livability indicator. In other words, the overlay is only visible when the livability indicator is also active for the selected stakeholder.
Legend
- Green (Good): Indicates a good livability, compared to the surroundings.
- Orange (Average): Indicates an average livability, compared to the surroundings.
- Color: Red (Bad): Indicates a bad livability, compared to the surroundings.
Additional information displayed in hover panel

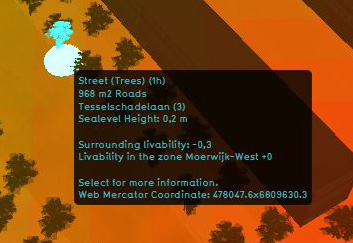
The hover panel gives additional information when the overlay is active.
Surrounding Livability
The value of livability in the surroundings.
Livability in the Zone
The average value of the livability in the entire zone
For information on adding and removing Overlays see...
Changing function values to change effects on the Livability
- Main article: Changing function values

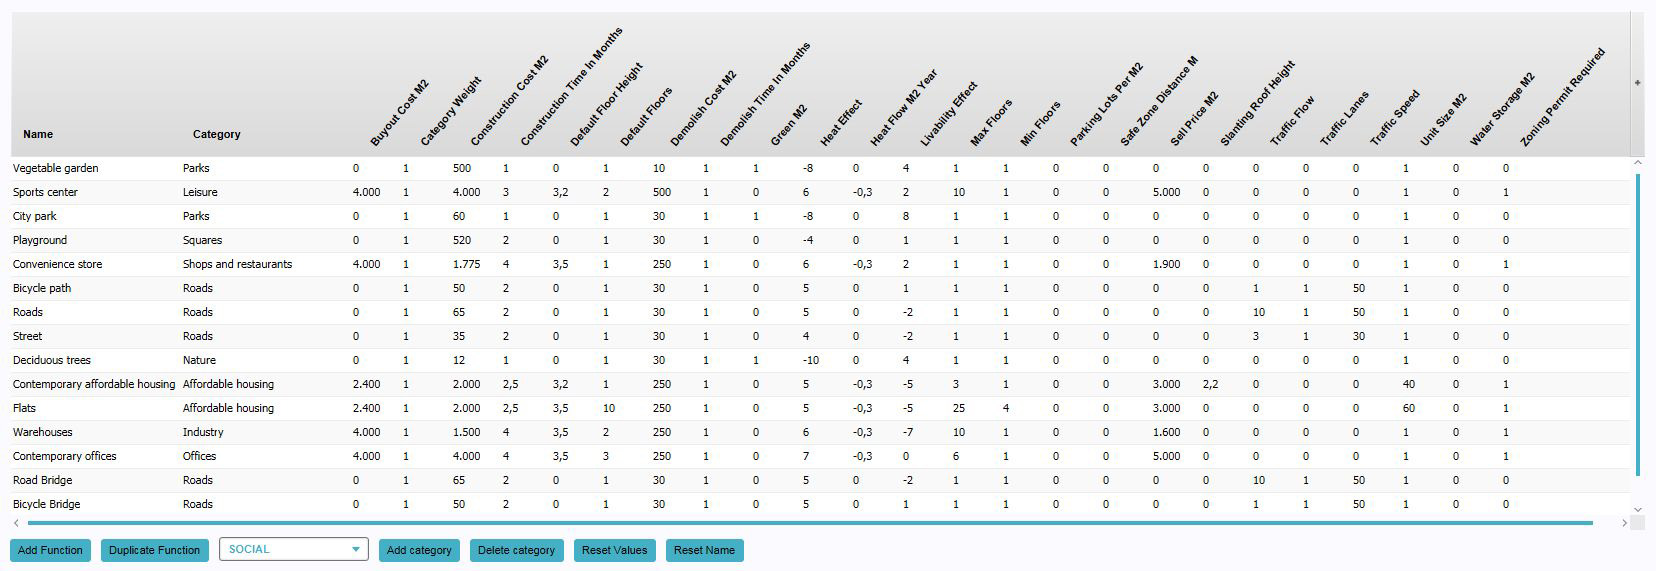
To change a function value to affect the Livability overlay (and indicator), look for the "Livability Effect" column and change the "Livability Effect" value for a certain construction. The overlay will update automatically.
- Select "Indicators" in the ribbon header
- Select "Function Values" in the ribbon bar
- The Function Values window will open
- Select a function in the Function Values window
- Change the "Livability Effect" Value for the selected function
- Confirm by pressing "Enter"
Adding and removing the Livability Overlay
Because the Livability Overlay is directly linked to the Livability indicator, it is currently not possible to load this Livability overlay separately. To activate the Livability overlay in you project, please see the documentation about Adding/removing indicators.