Average Overlay

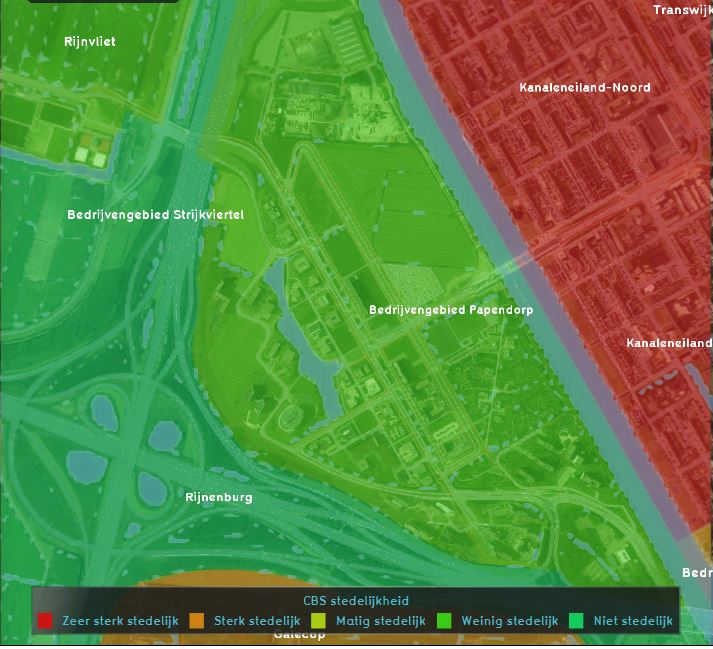
The Average (Grid) Overlay displays (smoothed) attribute values from buildings, terrains, areas or neighborhoods that are assigned to a grid cell. This overlay becomes available for each stakeholder. It is possible to create a custom dynamic Grid Overlay with the Average Overlay.
A typical use-case of the Average Overlay is to visualize parameters of a simulation model (e.g. the rainfall overlay). A parameter assigned to a grid-cell can be related to one or more layers of the 3D model: Buildings, Terrains, Areas and Neighborhoods.
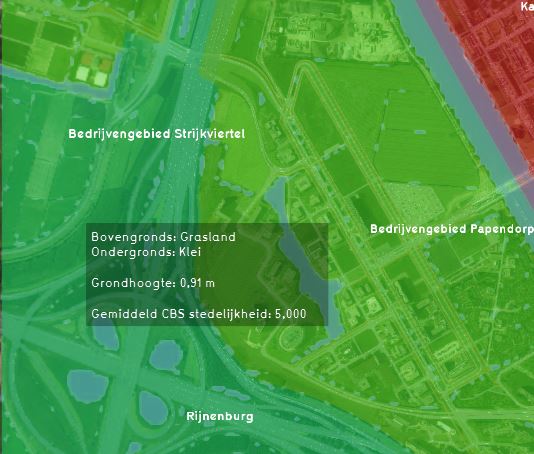
Additional information displayed in hover panel

When clicking on a specific location in the map of the Average Overlay, the hover panel gives additional information over the actual value in that specific grid cell.
How-to's