Attribute Overlay: Difference between revisions
No edit summary |
|||
| (19 intermediate revisions by 5 users not shown) | |||
| Line 1: | Line 1: | ||
[[File:Attribute_overlay_example.jpg|thumb|250px|left|The attribute overlay, displaying buildings with traffic flow.]] | |||
The attribute overlay is an overlay which highlights the presence of a specific attribute in a data layer. A data type, such as [[building]]s, [[neighborhood]]s, or [[area]]s, is checked. If the data has the specified attribute, it is highlighted in the [[3D Visualization]] by the overlay. This overlay becomes available for each stakeholder. | |||
[[File:Attribute_overlay_example. | |||
The attribute overlay is an overlay which | |||
<br clear=all> | <br clear=all> | ||
==Additional information displayed in hover panel== | ==Additional information displayed in hover panel== | ||
[[File:Overlays-attributeoverlay-hover. | [[File:Overlays-attributeoverlay-hover.jpg|thumb|250px|left|The hover panel of the attribute overlay displaying building data.]] | ||
When a specific (highlighted) location in the [[3D | When a specific (highlighted) location in the [[3D Visualization]] is clicked, the hover panel can display additional information on the underlying data. The name of the data item being highlighted is displayed, as well as the value of the attribute based on which it is being highlighted. For example, if [[building]]s are highlighted with the [[Traffic Model|TRAFFIC_FLOW]], it will display the name of the building, some information on its size, and the TRAFFIC_FLOW value. | ||
<br clear=all> | <br clear=all> | ||
| Line 23: | Line 20: | ||
For more information on how to realize the more dynamic use-cases, check the articles on [[Excel]], [[TQL]], the [[Geo Data Wizard]], and [[Attribute#COLOR|color attributes]]. | For more information on how to realize the more dynamic use-cases, check the articles on [[Excel]], [[TQL]], the [[Geo Data Wizard]], and [[Attribute#COLOR|color attributes]]. | ||
Especially when using the dynamic coloring, it is recommended to use the [[custom legend]] functionality to provide the end-user with explanations of the used colors. | |||
==Configuring the overlay== | ==Configuring the overlay== | ||
| Line 30: | Line 29: | ||
====Name==== | ====Name==== | ||
[[File:Overlays-right-attributeoverlay-name.jpg|frame|right|The field for the "name".]] | [[File:Overlays-right-attributeoverlay-name.jpg|frame|right|The field for the "name".]] | ||
: ''The name of the overlay. This is the name that will appear as the title overlay, when hovering over the related icon | : ''The name of the overlay. This is the name that will appear as the title overlay, when hovering over the related icon on the [[navigation panel]]. It is also the text in the [[Overlay legend panel]] of the overlay as description for the overlay. You can change this by altering the text in the "Name" field.''<br clear=right> | ||
====Attribute | ====Attribute Color and Background Color==== | ||
[[File:Overlays-right-attributeoverlay-color.jpg|frame|right|The fields for the "Attribute Color" and "Background Color".]] | [[File:Overlays-right-attributeoverlay-color.jpg|frame|right|The fields for the "Attribute Color" and "Background Color".]] | ||
: ''The colors of the overlay. The "Attribute Color" is the color used to indicate the data with the specified attribute in the 3D | : ''The colors of the overlay. The "Attribute Color" is the color used to indicate the data with the specified attribute in the 3D Visualization. Note that this will be overwritten if a color attribute is set. The "Background Color" is the color used to color all other areas. You can toggle this on or off with the checkbox. You can change both colors by selecting the color field. A panel will appear in which you can specify the desired color.''<br clear=right> | ||
====Type==== | ====Type==== | ||
| Line 42: | Line 41: | ||
====Filter Attribute==== | ====Filter Attribute==== | ||
[[File:Overlays-right-attributeoverlay-filter-attribute.jpg|frame|right|The attribute which should be highlighted by the overlay.]] | [[File:Overlays-right-attributeoverlay-filter-attribute.jpg|frame|right|The attribute which should be highlighted by the overlay.]] | ||
: ''The | : ''The attribute which should be present for the data to be highlighted. To select an attribute which already exists, the "Select" option can be used. It is also possible to enter an attribute name yourself.''<br clear=right> | ||
====Color Attribute==== | ====Color Attribute==== | ||
[[File:Overlays-right-attributeoverlay-color-attribute.jpg|frame|right|The attribute which defines the color to be used to highlight this data.]] | [[File:Overlays-right-attributeoverlay-color-attribute.jpg|frame|right|The attribute which defines the color to be used to highlight this data.]] | ||
: ''If set, this attribute is used to determine the color with which to highlight the data. This allows for a more detailed overview of the highlighted data. | : ''If set, this attribute is used to determine the color with which to highlight the data. This allows for a more detailed overview of the highlighted data. To select an attribute which already exists, the "Select" option can be used. It is also possible to enter an attribute name yourself.''<br clear=right> | ||
==How-to's== | |||
* [[How to add and remove an Overlay]] | |||
* [[How to edit an overlay legend]] | |||
* [[How to add and remove an Attribute]] | |||
{{Template:Overlay nav}} | |||
{{ | |||
Latest revision as of 09:29, 28 September 2023
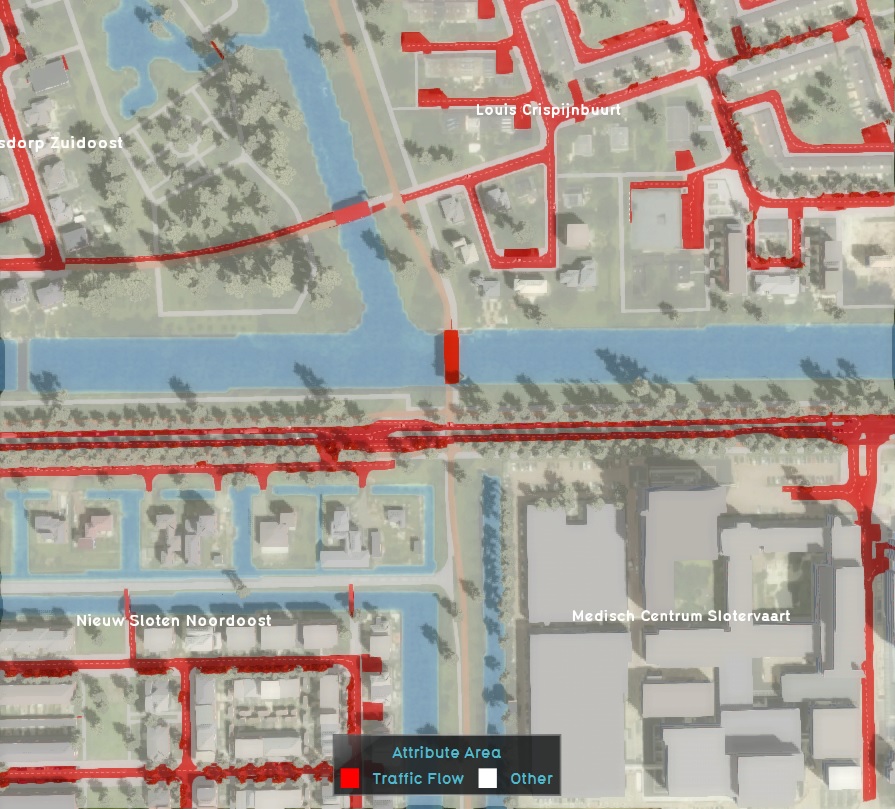
The attribute overlay is an overlay which highlights the presence of a specific attribute in a data layer. A data type, such as buildings, neighborhoods, or areas, is checked. If the data has the specified attribute, it is highlighted in the 3D Visualization by the overlay. This overlay becomes available for each stakeholder.
Additional information displayed in hover panel
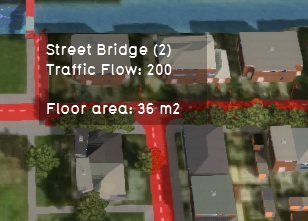
When a specific (highlighted) location in the 3D Visualization is clicked, the hover panel can display additional information on the underlying data. The name of the data item being highlighted is displayed, as well as the value of the attribute based on which it is being highlighted. For example, if buildings are highlighted with the TRAFFIC_FLOW, it will display the name of the building, some information on its size, and the TRAFFIC_FLOW value.
Purpose of the Attribute Overlay
The primary purpose of the attribute overlay is to highlight data with a specific attribute. This allows for simple, slightly dynamic visualizations of data such as:
- Buildings with traffic data.
- Zones with building height restrictions.
The overlay can be further enhanced with some in-software calculations or external processing. By calculating the desired color which should be used to display data (either using excels and TQL statements, or by preprocessing data in an external program and then loading the results in your project), it's possible to differentiate data in the map using multiple colors. This can allow you to visualize data such as:
- The ages of constructions.
- The types of buildings in the world.
- Self-calculated scores for areas or neighborhoods
For more information on how to realize the more dynamic use-cases, check the articles on Excel, TQL, the Geo Data Wizard, and color attributes.
Especially when using the dynamic coloring, it is recommended to use the custom legend functionality to provide the end-user with explanations of the used colors.
Configuring the overlay

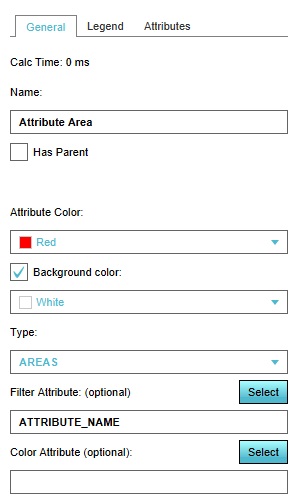
By default, the overlay does not display any relevant information. The properties of this overlay must be configured first, most notably the attribute based on which to highlight data.
Name
- The name of the overlay. This is the name that will appear as the title overlay, when hovering over the related icon on the navigation panel. It is also the text in the Overlay legend panel of the overlay as description for the overlay. You can change this by altering the text in the "Name" field.
Attribute Color and Background Color
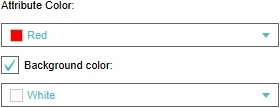
- The colors of the overlay. The "Attribute Color" is the color used to indicate the data with the specified attribute in the 3D Visualization. Note that this will be overwritten if a color attribute is set. The "Background Color" is the color used to color all other areas. You can toggle this on or off with the checkbox. You can change both colors by selecting the color field. A panel will appear in which you can specify the desired color.
Type
- The data type which should be checked by the overlay. The type of data you wish to highlight must be explicitly selected. You can change the data type by selecting a different type in the dropdown menu.
Filter Attribute
- The attribute which should be present for the data to be highlighted. To select an attribute which already exists, the "Select" option can be used. It is also possible to enter an attribute name yourself.
Color Attribute
- If set, this attribute is used to determine the color with which to highlight the data. This allows for a more detailed overview of the highlighted data. To select an attribute which already exists, the "Select" option can be used. It is also possible to enter an attribute name yourself.
How-to's


