Aerius Overlay: Difference between revisions
No edit summary |
No edit summary |
||
| (34 intermediate revisions by 4 users not shown) | |||
| Line 1: | Line 1: | ||
The | {{unavailable}} | ||
{{Aerius Module buttons}} | |||
The Aerius | __NOTOC__ | ||
The Aerius Overlay shows the calculated results of the [[Aerius Module]], which forms the connection between the {{software}} and the Aerius Calculator, version 2020. The Aerius Overlay is currently in BETA. | |||
The Aerius overlay visualizes the NOX and NH3 deposition on Natura 2000 areas. | |||
See for more information the [[Aerius module overview|Aerius overview]]. <br> | |||
The Aerius results, including the entered values per emission source, can also be [[How_to_download_Aerius_results|downloaded]] as a GML file. This file can then be uploaded in the [https://calculator.aerius.nl/calculator/?locale=nl# Aerius Calculator]. | |||
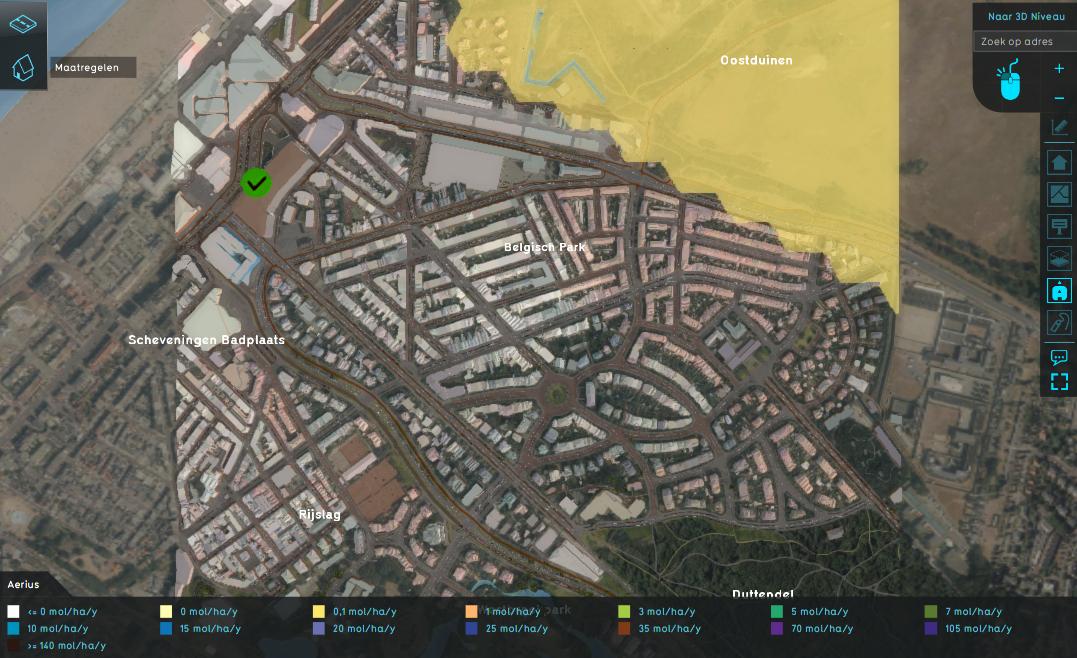
[[File:nox_result_type.jpeg|thumb|420px|left|Example of the Aerius Overlay NOX result type]] | |||
= | <br clear=all> | ||
==Configuration== | |||
An Aerius Overlay can be configured by opening the Aerius Overlay Wizard. See [[How to add the Aerius Overlay]]. | |||
==Result types== | |||
{{result types|suppresscategory=true|allowselflinks=true| | |||
{{:NOX result type (Aerius Overlay)}} | |||
{{:NH3 result type (Aerius Overlay)}} | |||
}} | |||
<ul> | |||
<li style = "display:inline-block">[[File:nox_result_type.jpeg|200xpx|the NOX result type]]</li> | |||
<li style = "display:inline-block">[[File:nh3_result_type.jpeg|200xpx|the NH3 result type]]</li> | |||
</ul> | |||
==Notes== | ==Notes== | ||
When the Aerius Overlay is [[recalculate]]d and does not visualize any data, then this could mean either: <br> | |||
1. There is no deposition on Natura 2000 areas. <br> | |||
2. There is deposition on Natura 2000 areas, but there is no Natura 2000 area in the {{software}} project (and therefore the deposition cannot be shown in the project). To check if this is the case, take a look at the values of the [[Nox_overlay_attribute_(Aerius_Overlay)|NOX]] and [[Nh3_overlay_attribute_(Aerius_Overlay)|NH3]] attributes. | |||
==How-to's== | ==How-to's== | ||
* [[How to add the Aerius Overlay]] | |||
* [[How to download Aerius results]] | |||
* [[How to add and remove an Overlay]] | * [[How to add and remove an Overlay]] | ||
* [[How to edit an overlay legend|Edit an overlay legend]] | * [[How to edit an overlay legend|Edit an overlay legend]] | ||
{{AeriusOverlay result type nav}} | |||
{{ | [[Category:Overlays with result types]] | ||
{{Overlay_nav}} | |||
Latest revision as of 13:43, 3 November 2023
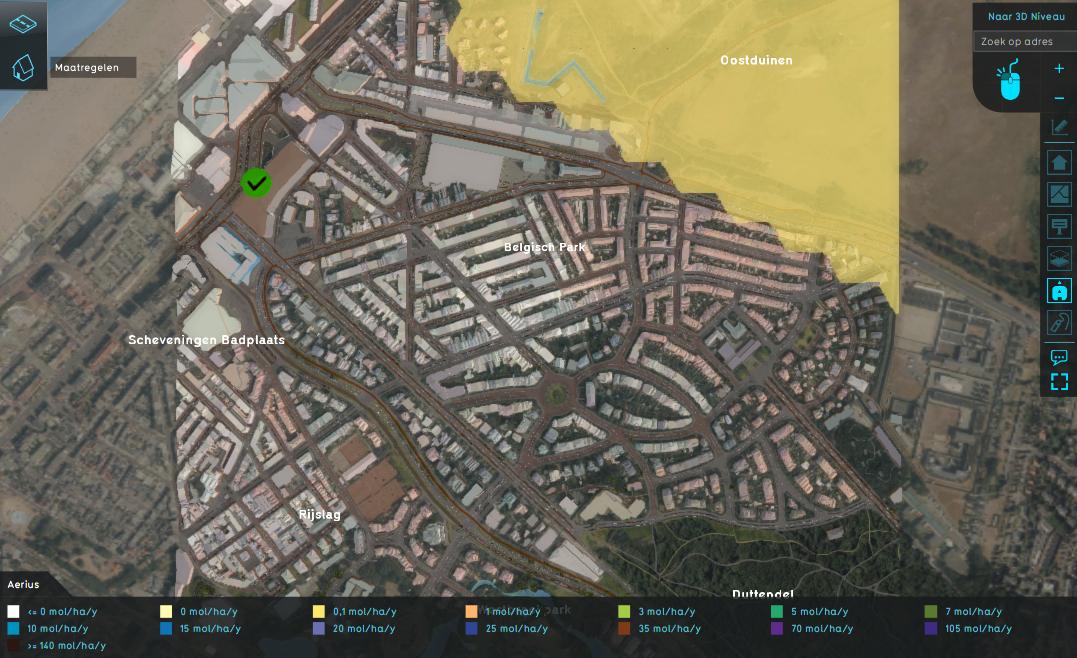
The Aerius Overlay shows the calculated results of the Aerius Module, which forms the connection between the Tygron Platform and the Aerius Calculator, version 2020. The Aerius Overlay is currently in BETA.
The Aerius overlay visualizes the NOX and NH3 deposition on Natura 2000 areas.
See for more information the Aerius overview.
The Aerius results, including the entered values per emission source, can also be downloaded as a GML file. This file can then be uploaded in the Aerius Calculator.
Configuration
An Aerius Overlay can be configured by opening the Aerius Overlay Wizard. See How to add the Aerius Overlay.
Result types
| Icon | Result type | Unit | Mode | Description |
|---|---|---|---|---|
| |
NOX | mol/ha/year | The amount of NOX deposited in mol per hectare per year in Natura 2000 areas due to the supplied emission sources. | |
| |
NH3 | mol/ha/year | The amount of NH3 deposited in mol per hectare per year in Natura 2000 areas due to the supplied emission sources. |
Notes
When the Aerius Overlay is recalculated and does not visualize any data, then this could mean either:
1. There is no deposition on Natura 2000 areas.
2. There is deposition on Natura 2000 areas, but there is no Natura 2000 area in the Tygron Platform project (and therefore the deposition cannot be shown in the project). To check if this is the case, take a look at the values of the NOX and NH3 attributes.
How-to's
- How to add the Aerius Overlay
- How to download Aerius results
- How to add and remove an Overlay
- Edit an overlay legend


