Inference Overlay: Difference between revisions
No edit summary Tag: Reverted |
Undo revision 63569 by Maxim@tygron.com (talk) Tag: Undo |
||
| (2 intermediate revisions by the same user not shown) | |||
| Line 5: | Line 5: | ||
It is not possible to run the convolution network on the grid as a whole. Therefore, a marching window strategy is applied instead, where the window is moved over the input grid with a [[Stride fraction (Inference Overlay)|configurable stride]]. This window takes the input values of one or more grids and puts these into tensors representing either floating point values or color channels (red, green and blue). Depending on the dataset used to train the neural network, the tensor values are normalized based on a particular value range. For example, a relative height input tensor for a foliage neural network trained on height data can be normalized using a range of 0 to 40 meters, when 40 meters is considered the largest tree height in the Netherlands. | It is not possible to run the convolution network on the grid as a whole. Therefore, a marching window strategy is applied instead, where the window is moved over the input grid with a [[Stride fraction (Inference Overlay)|configurable stride]]. This window takes the input values of one or more grids and puts these into tensors representing either floating point values or color channels (red, green and blue). Depending on the dataset used to train the neural network, the tensor values are normalized based on a particular value range. For example, a relative height input tensor for a foliage neural network trained on height data can be normalized using a range of 0 to 40 meters, when 40 meters is considered the largest tree height in the Netherlands. | ||
==Foliage Example== | ==Foliage Example== | ||
| Line 22: | Line 20: | ||
{{article end | {{article end | ||
|seealso= | |seealso= | ||
* [[Model attributes (Inference Overlay)]] | * [[Model attributes (Inference Overlay)]] | ||
* [[Neural Network]] | * [[Neural Network]] | ||
| Line 33: | Line 30: | ||
* [[How to import trees based on an Inference Overlay]] | * [[How to import trees based on an Inference Overlay]] | ||
* [[How to detect solar panels using an Inference Overlay]] | * [[How to detect solar panels using an Inference Overlay]] | ||
* [[How to | * [[How to create the input overlay for leafless trees detection using the Inference Overlay]] | ||
* [[How to train your own AI model for an Inference Overlay]] | |||
* [[How to select specific input data for AI Inference]] | * [[How to select specific input data for AI Inference]] | ||
* [[How to | * [[How to create AI train data with QGIS]] | ||
}} | }} | ||
{{InferenceOverlay nav}} | {{InferenceOverlay nav}} | ||
{{Overlay nav}} | {{Overlay nav}} | ||
Latest revision as of 15:09, 17 October 2025

The AI Inference Overlay is a Grid Overlay which can spatially identify features using one or more Prequel Grids. Features are identified using a Convolution Neural Network that used a limited amount of proposal regions (RCNN). This Neural Network takes a subsection (window) of the input grid and either;
- classifies the image as a whole
- detect one or more features in that image.
It is not possible to run the convolution network on the grid as a whole. Therefore, a marching window strategy is applied instead, where the window is moved over the input grid with a configurable stride. This window takes the input values of one or more grids and puts these into tensors representing either floating point values or color channels (red, green and blue). Depending on the dataset used to train the neural network, the tensor values are normalized based on a particular value range. For example, a relative height input tensor for a foliage neural network trained on height data can be normalized using a range of 0 to 40 meters, when 40 meters is considered the largest tree height in the Netherlands.
Foliage Example

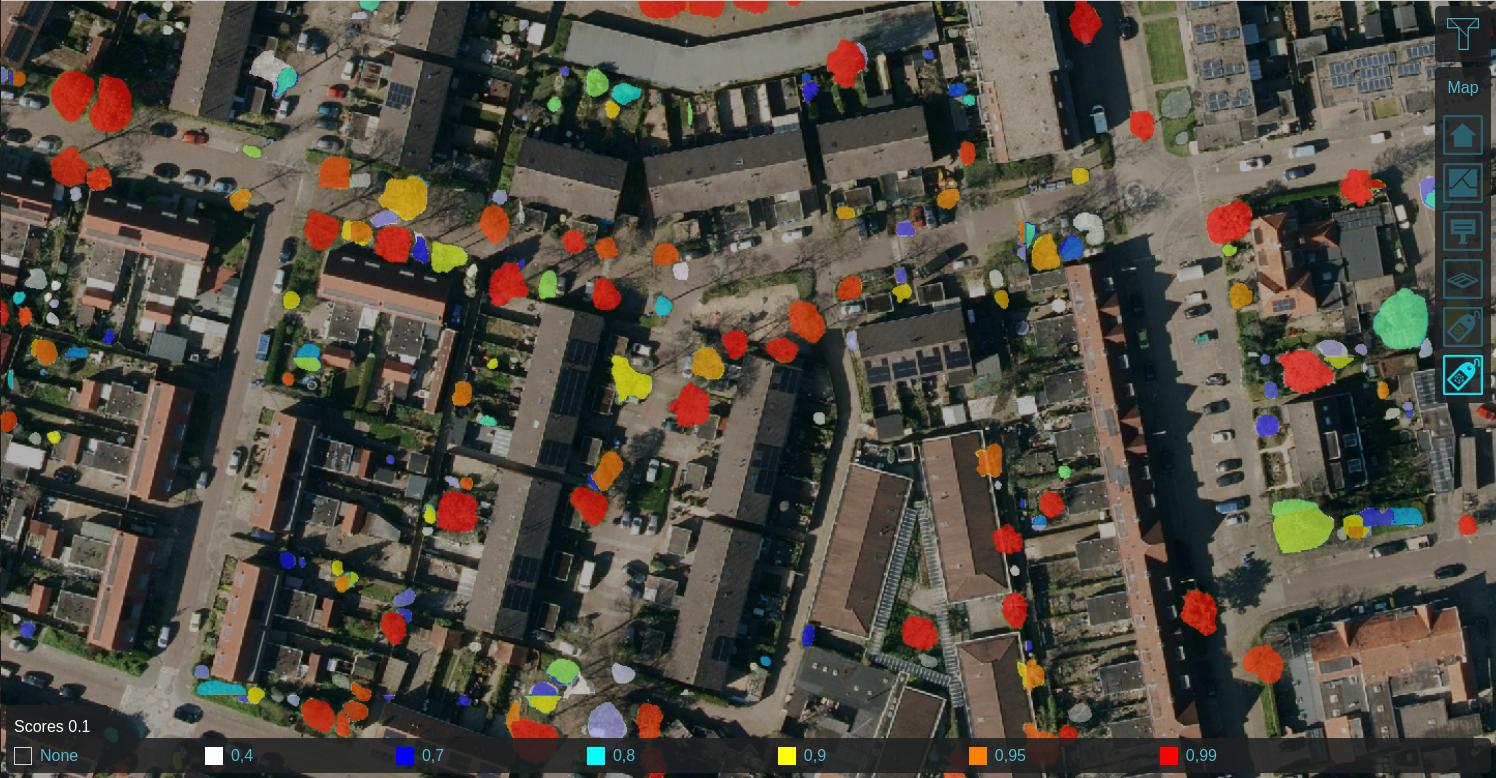
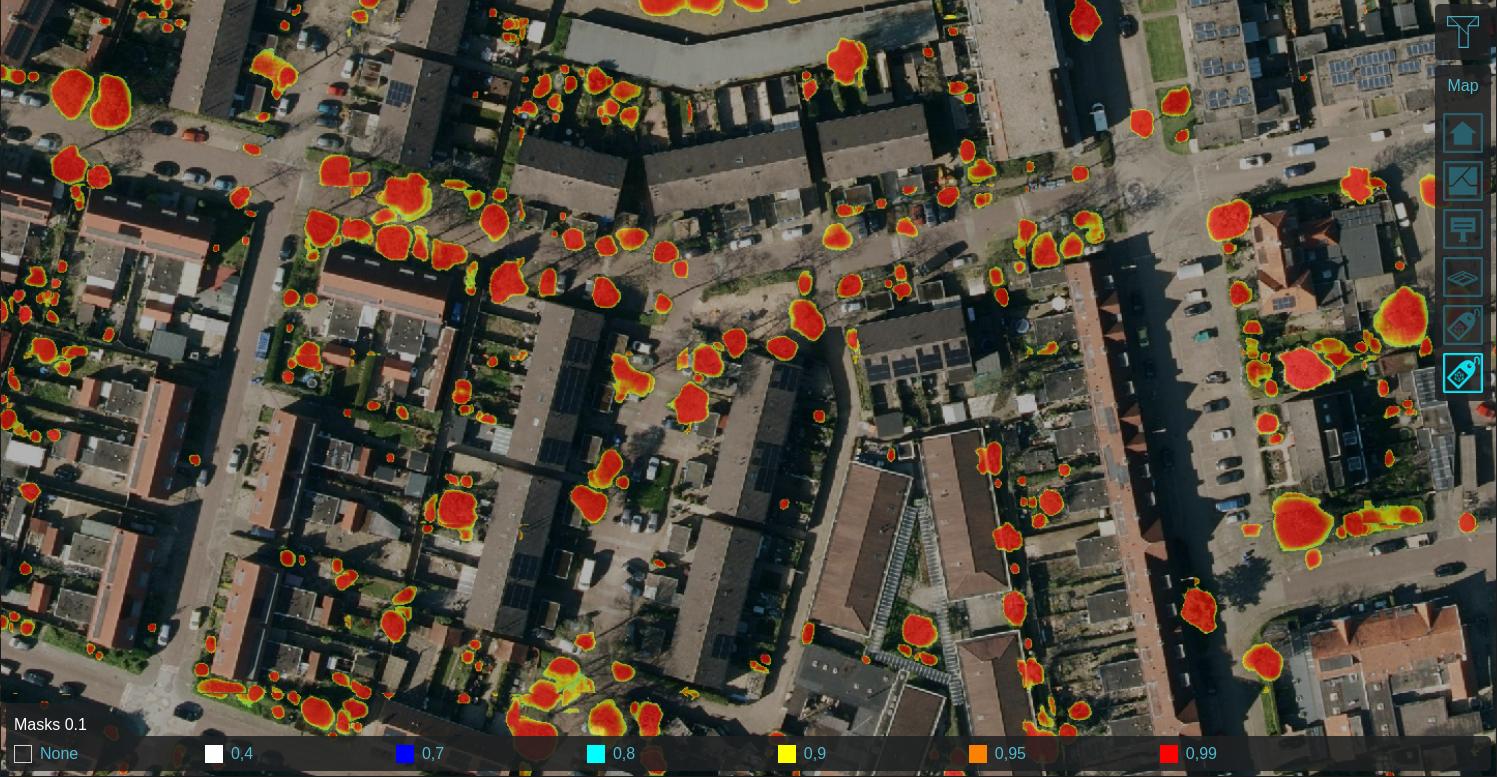
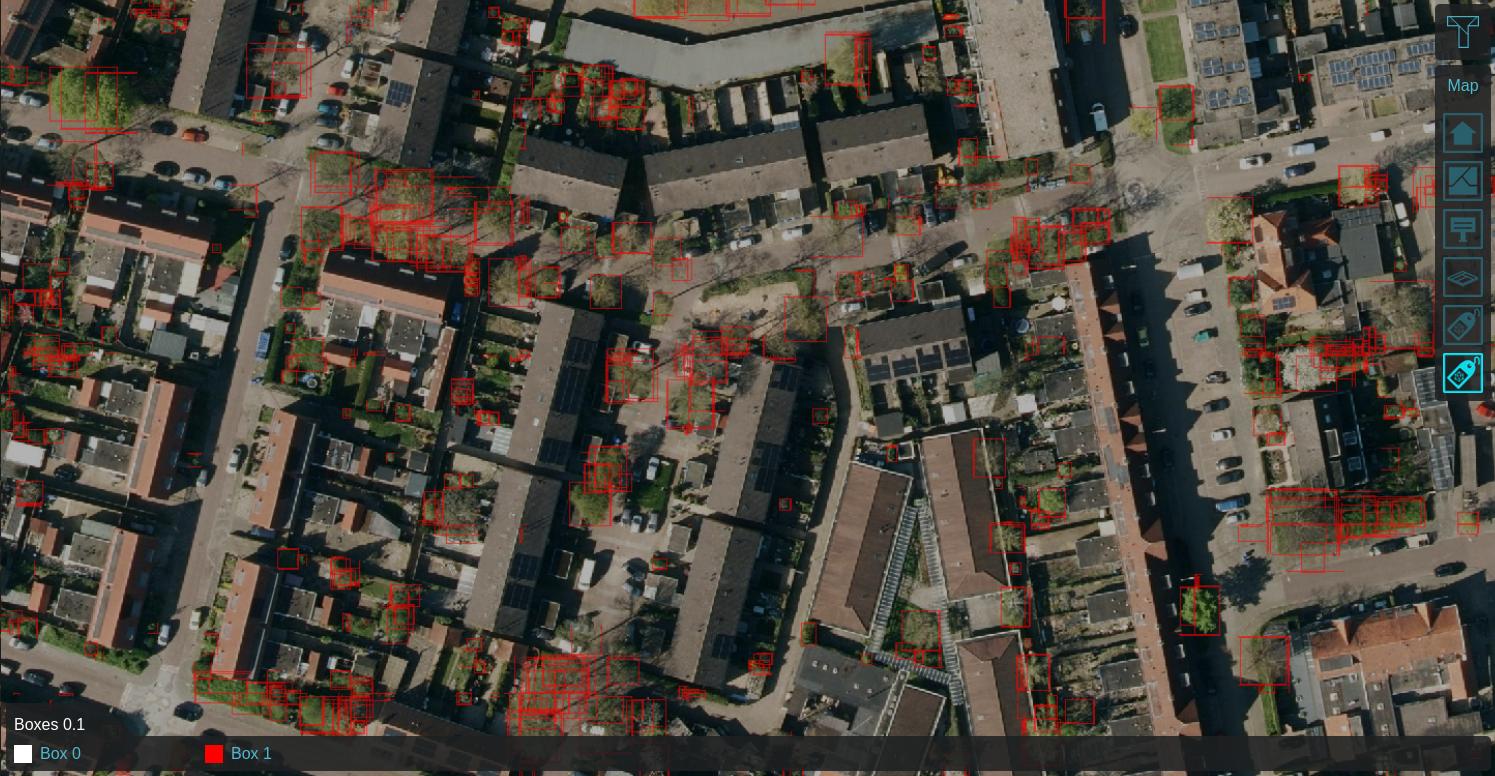
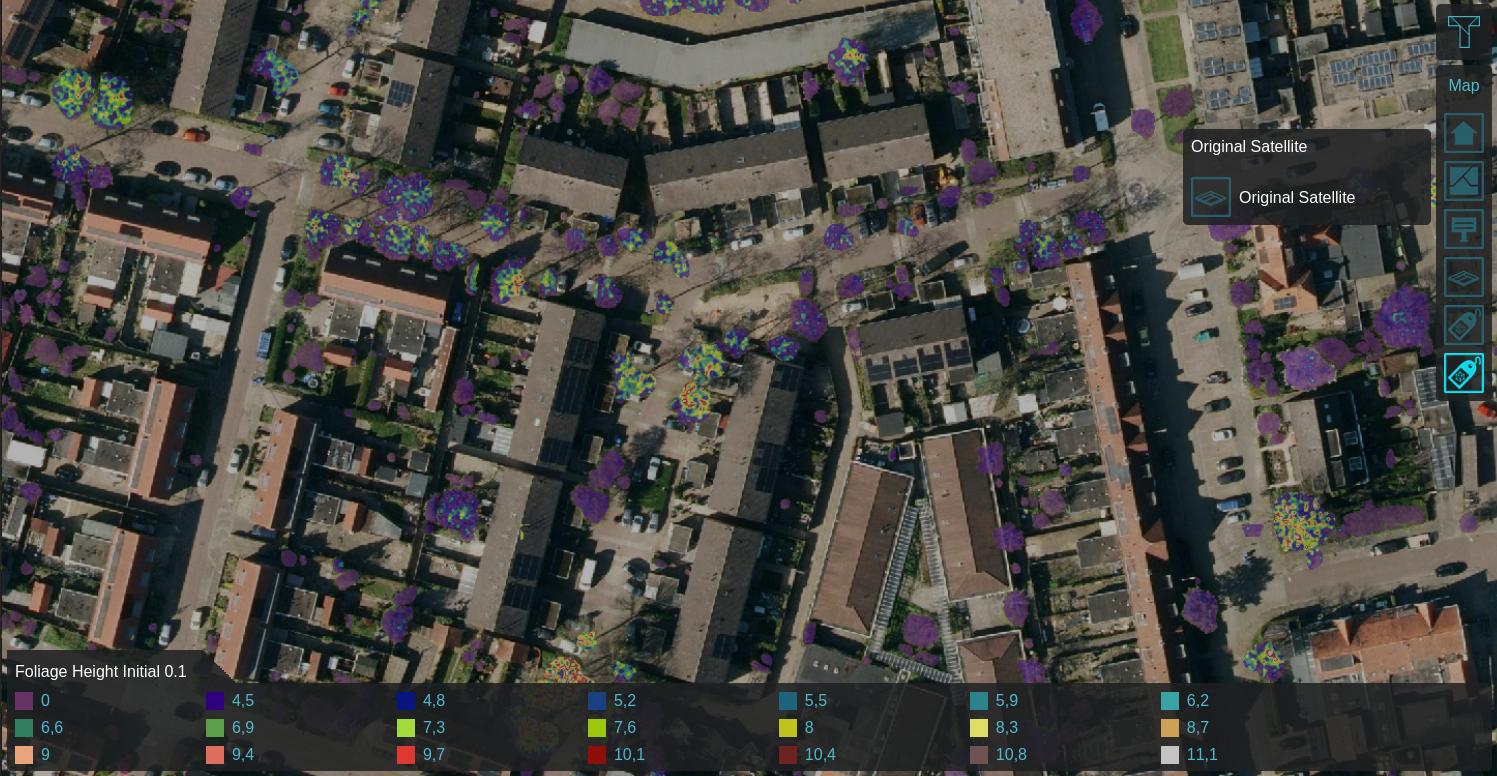
Using a Satellite Overlay of 0.25m detail, foliage features can be identified using an Inference Overlay and enhanced with a Digital Terrain Model Overlay (DTM), a WCS Overlay representing the DSM, Combo Overlay to combine these and an optionally an iterative Max Overlay to enhance the foliage height. For more information, see this how-to.
-
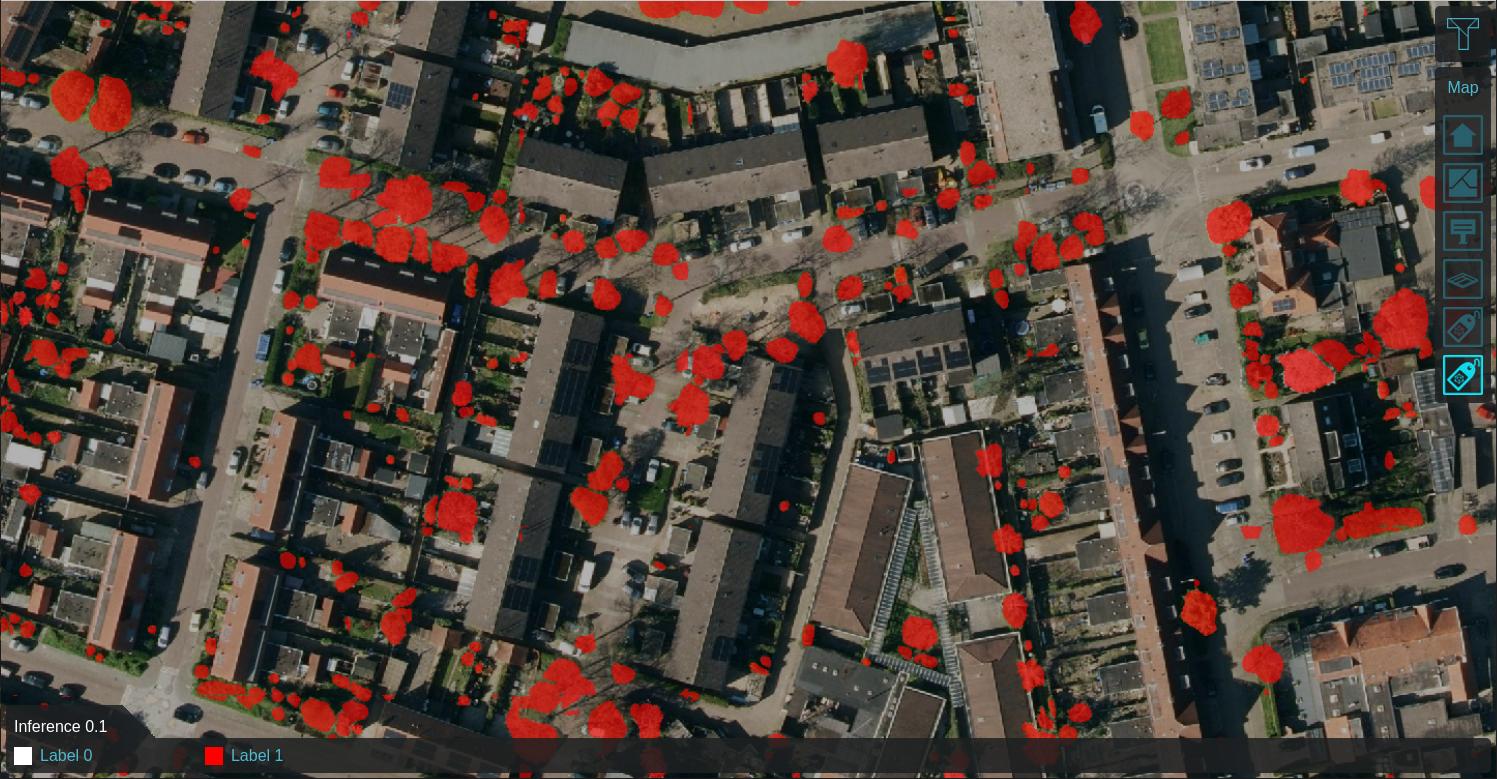 Labeled features on 0.25m satellite image
 -
-
-
-
-
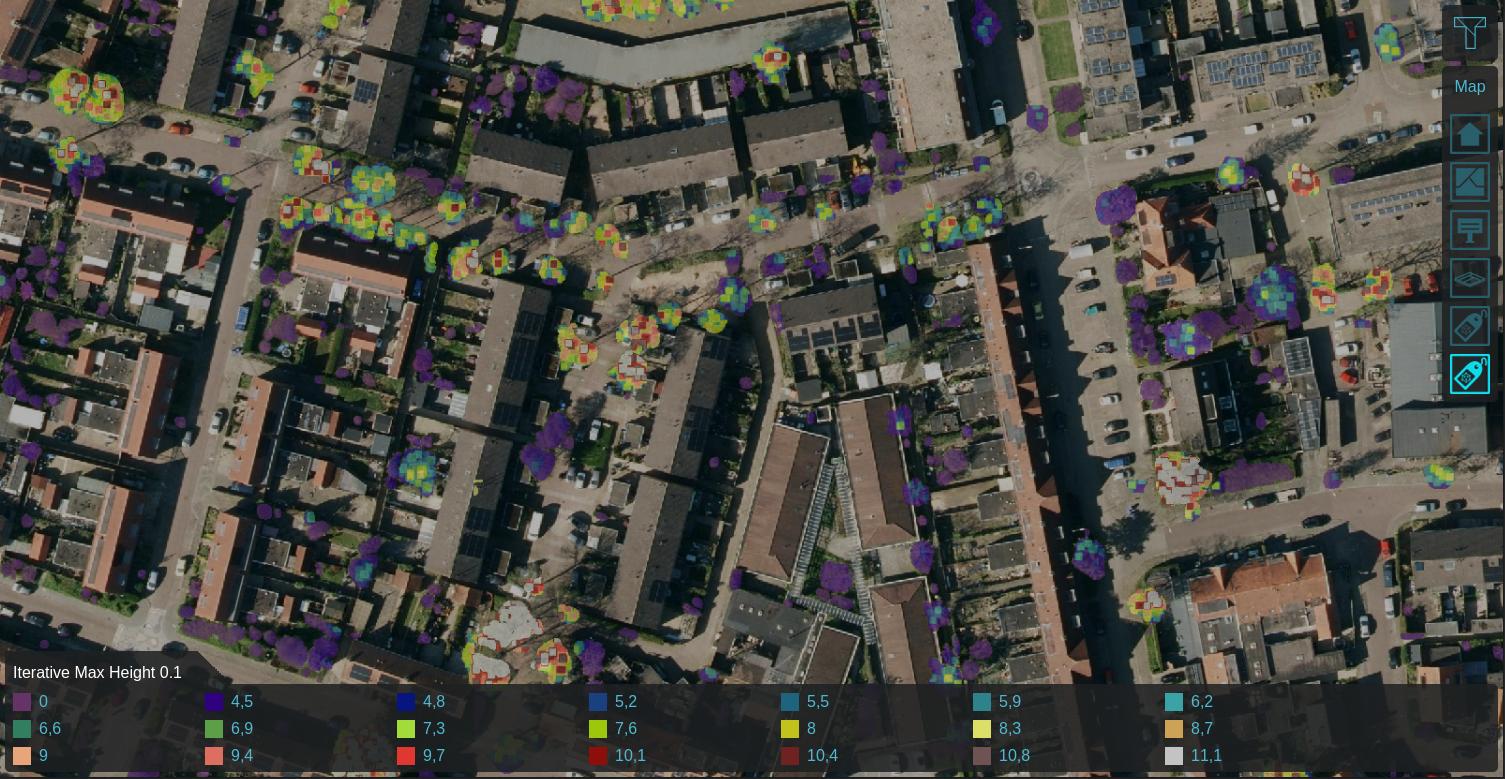 Max neighboring height within 0.25m, iterated 5 times


How-to's
- How to detect foliage using an Inference Overlay
- How to create foliage height based on an Inference Overlay
- How to import trees based on an Inference Overlay
- How to detect solar panels using an Inference Overlay
- How to create the input overlay for leafless trees detection using the Inference Overlay
- How to train your own AI model for an Inference Overlay
- How to select specific input data for AI Inference
- How to create AI train data with QGIS
See also


