Average Overlay: Difference between revisions
| Line 28: | Line 28: | ||
: Use the defined [[Attribute]]'s value from the specific layer of vector data specified. Exactly one layer can be specified. If no such [[Attribute]] exists in a specific location, the used value is 0. | : Use the defined [[Attribute]]'s value from the specific layer of vector data specified. Exactly one layer can be specified. If no such [[Attribute]] exists in a specific location, the used value is 0. | ||
; Grid | ; Grid Overlay | ||
: Use the value as calculated by another [[Grid Overlay]]. No [[Attribute]] needs to be specified. Instead, a specific [[Overlay]] is referenced. {{nodata}} values of the referenced Overlay result in {{nodata}} values in the grid. The Average Overlay will have [[timeframe]]s equal to the amount of [[timeframe]]s of the Input Overlay. | : Use the value as calculated by another [[Grid Overlay]]. No [[Attribute]] needs to be specified. Instead, a specific [[Overlay]] is referenced. {{nodata}} values of the referenced Overlay result in {{nodata}} values in the grid. The Average Overlay will have [[timeframe]]s equal to the amount of [[timeframe]]s of the Input Overlay. | ||
Revision as of 09:23, 10 February 2022

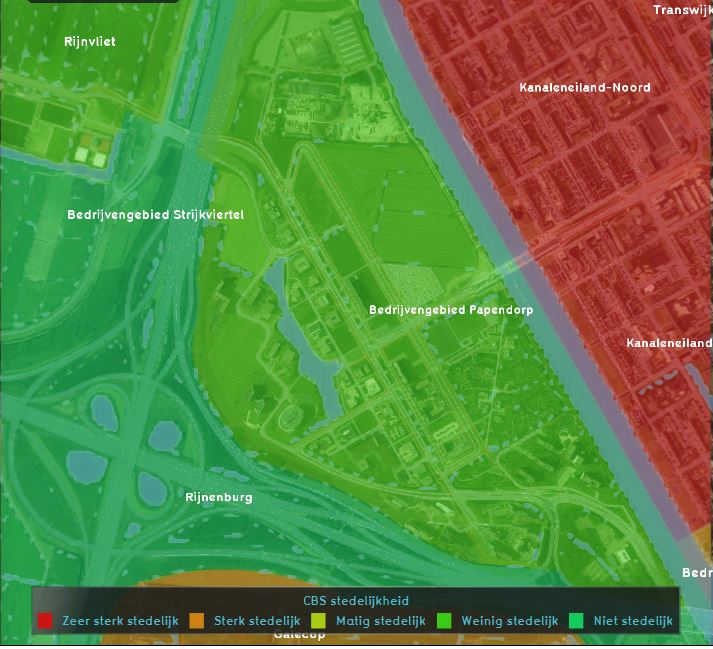
The Average Overlay is a multi purpose Grid Overlay which displays (smoothed) values. These values can originate from 2D spatial objects, such as buildings, terrains, areas or neighborhoods. The values can also originate from an other Grid Overlay.
Another typical use-case of the Average Overlay is to visualize parameters of a simulation model (e.g. the rainfall overlay). A parameter assigned to a grid-cell can be related to one or more layers of the 3D model: Buildings, Addresses, Terrains, Areas, Neighborhoods and Net Lines.
Thirdly the Average overlay supports replacing NO_DATA values with interpolated non NO_DATA values using surrounding cells within a specified distance.
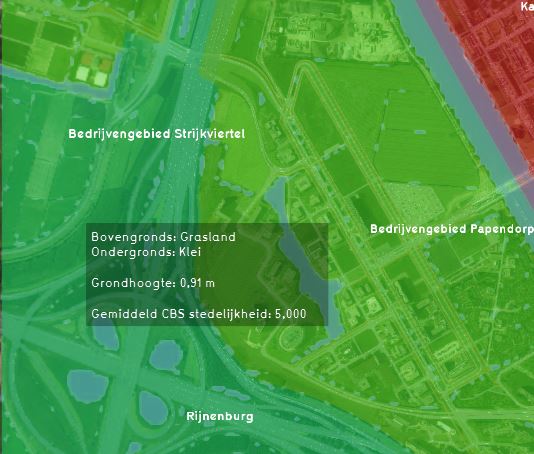
Additional information displayed in hover panel

When clicking on a specific location in the map of the Average Overlay, the hover panel gives additional information over the actual value in that specific grid cell.
Calculation
The Average Overlay works by first computing a grid of input values. This is a 1-on-1 representation of the data found spatially in the Project. Then, for each grid cell, the values of all cells within a given radius from that one cell are summed up, and divided by the total amount of cells found in that radius. The output value of that one cell is that computed average.
The Average Overlay can be configured to fine-tune the exact data which should serve as input, and how the calculation should take place.
Input
The Average Overlay requires an initial input, which it can then average out over a specified range. The input can be either an Attribute of vector data, or a Grid Overlay. The following options are available:
- Attribute First Layer
- Use the first value found among the layers of vector data which have the specified Attribute. If no such Attribute exists in a specific location, the used value is 0.
- Attribute Min Layer / Max Layer
- Use either the lowest or the highest value found among the layers of vector data which have the specified Attribute. If no such Attribute exists in a specific location, the used value is 0.
- Attribute Specific Layer
- Use the defined Attribute's value from the specific layer of vector data specified. Exactly one layer can be specified. If no such Attribute exists in a specific location, the used value is 0.
- Grid Overlay
- Use the value as calculated by another Grid Overlay. No Attribute needs to be specified. Instead, a specific Overlay is referenced. NO_DATA values of the referenced Overlay result in NO_DATA values in the grid. The Average Overlay will have timeframes equal to the amount of timeframes of the Input Overlay.
Calculation
Based on the input, the Average Overlay can average out the found values across some radius. The means of calculation are defined by Attributes, and can most easily be set using the Average Overlay Wizard.
Attributes
The calculation can be configured via the following attributes:
No data interpolation (Average Overlay)
| Icon | Attribute | Unit | Range | Description | Default value |
|---|---|---|---|---|---|
| |
ATTRIBUTE_TIMEFRAMES | integer | 1 to 1000 | The amount of timeframes to display when basing input on Attribute arrays. | 1 |
| |
DISTANCE_M | m | 0 to 2000.0 | The radius within which an average value must be computed. | 100 |
Input Overlay
Input Overlays are a variant of average overlays that provide additional insights in the data used for complex Overlay models (e.g the Water Overlay or Heat Stress Overlay). Input Overlays can be made visible in the 3D model by selecting them in the Wizard or adding them manually.
How-to's
- How to use the Average Overlay Wizard
- How to add and remove an Overlay
- How to edit an overlay legend
External links