|
|
| Line 20: |
Line 20: |
|
| |
|
| ==How-to's== | | ==How-to's== |
| ''The Neigborhood overlay is added by default when creating a new project.''
| | * [[|How-to_add_and_remove_Neighborhoods_(Overlay)|Add or Remove a Neighborhood overlay]] |
|
| |
|
| {{Editor ribbon|header=Geo Data|bar=Overlays}}
| |
|
| |
|
| {{Editor steps|title=add the Neighborhood Overlay|Select in the editor 'Geo Data' from the ribbon|Select 'Overlays' from the ribbon bar|Select the desired overlay from the option menu at the bottom of the [[left panel]]| Select 'Add' at the bottom of the [[left panel]]| Notice that the new Neighborhood Overlay has been added to the list of active overlays. }}
| | ==Notes== |
| <gallery mode="nolines">
| | *The Neigborhood overlay is added by default when creating a new project. |
| File:Geo_data.png|1. Select Geo Data
| |
| File:Overlays.jpg|2. Select Overlays
| |
| File:Neighborhood_option.jpg|3. Select desired overlay from drop down menu on the bottom of the [[left panel]]
| |
| File:Add.jpg|4. Select 'Add' from the bottom of the [[left panel]]
| |
| File:Neighborhoods_list.jpg|5. The overlay will now appear in the list of active overlays on the [[left panel]]
| |
| </gallery>
| |
| <br clear=all>
| |
| | |
| {{Editor steps|title=remove the Neighborhood Overlay|Select in the editor 'Geo Data' from the ribbon|Select 'Overlays' from the ribbon bar|Select the desired overlay from the list of active overlays on the [[left panel]]|Select 'remove' from the bottom of the [[left panel]]|Confirm the removal in the pop up confirmation message}}
| |
| <gallery mode="nolines">
| |
| File:Geo_data.png|1. Select Geo Data
| |
| File:Overlays.jpg|2. Select Overlays
| |
| File:Neighborhoods_list.jpg|3. Select the overlay from the list of active overlays on the [[left panel]]
| |
| File:Remove_.jpg|4. Select 'Remove' from the bottom of the [[left panel]]
| |
| File:Confirm.jpg|5. Confirm the removal in the pop up message
| |
| </gallery>
| |
| <br clear=all>
| |
|
| |
|
| {{Template:Overlay nav}} | | {{Template:Overlay nav}} |
Revision as of 08:37, 2 April 2019
Template:Learned
What the Neighborhoods Overlay is
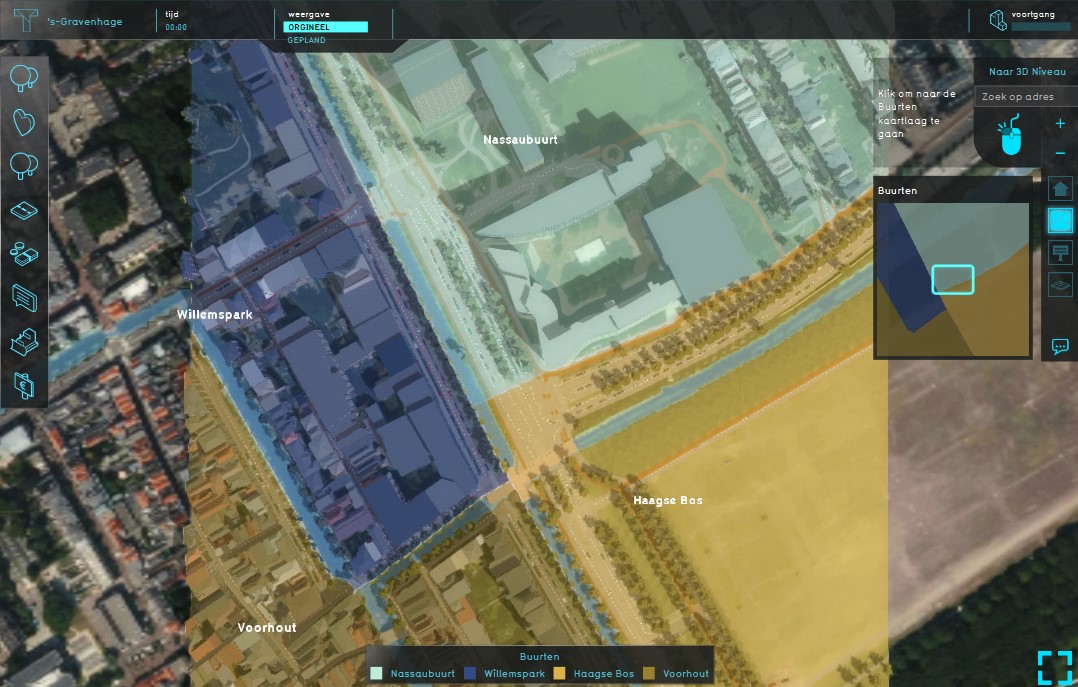
Example of the Neighborhoods Overlay
The Neighborhoods overlay shows the division of the project area in neighborhoods. These neighborhoods also contain statistical data concerning the whole neighborhood.
The data used for this overlay is from the CBS Wijk- en Buurtkaart. See for more information on this dataset the geo data page.
This overlay is added by default.
If the project is from a location outside the Netherlands or an empty map, the Neighborhoods overlay will show a division in 4 equal parts: Northwest, Northeast, Southwest and Southeast.
Additional information displayed in hover panel
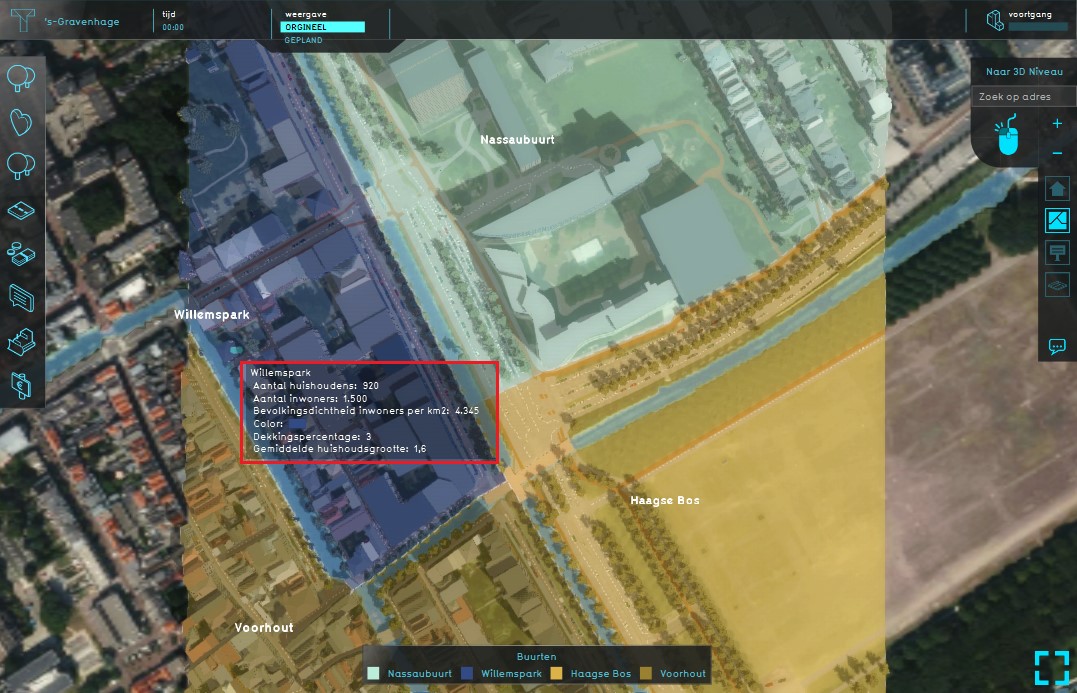
Hover panel displays additional information
When clicking on a specific location in the map, the hover panel gives additional information about the:
- name of the neighborhood
- the number of households
- the number of inhabitants
- the population density
- the coverage percentage
- the average household
Keep in mind that the data presented is for the entire neighborhood, even if your project only contains a small part of that neighborhood. It is not recalculated for the part that is within your project.
How-to's
- [[|How-to_add_and_remove_Neighborhoods_(Overlay)|Add or Remove a Neighborhood overlay]]
Notes
- The Neigborhood overlay is added by default when creating a new project.

