Traffic Density Overlay: Difference between revisions
Jump to navigation
Jump to search
No edit summary |
m (Rudolf@tygron.nl moved page Traffic Density (Overlay) to Traffic Density Overlay) |
(No difference)
| |
Revision as of 13:14, 5 August 2020
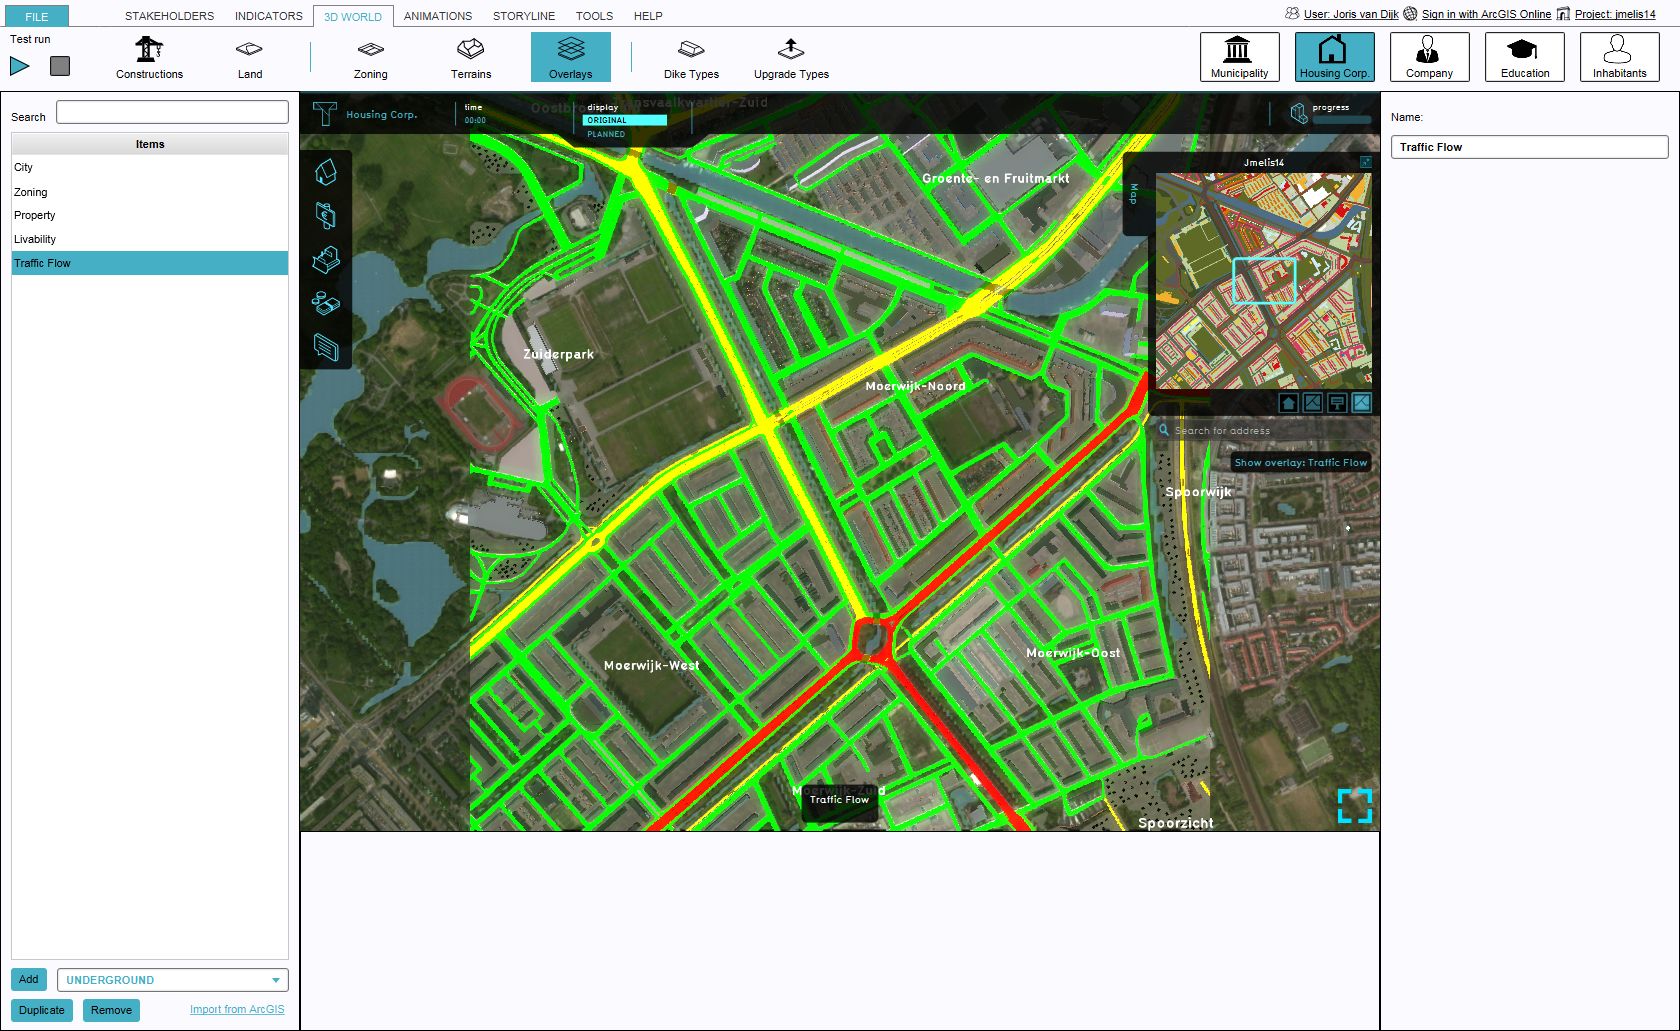
The Traffic Density Overlay is an overlay which is used for displaying traffic density on a road section on the map. When added to your project, it can be activated by clicking the corresponding icon on the minimap. When activated the Traffic Density Overlay displays 3 colors, red, yellow and green. Different colors mean different densities of traffic on this this road section.
This overlay becomes available for all stakeholders when added to a project.
Legend
- Green: 0-5 units / Minute
- Yellow: 6-25 units / Minute
- Red: 26+ Units / Minute
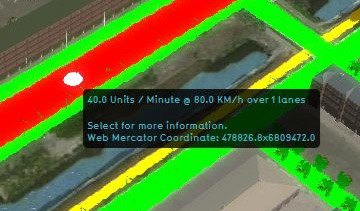
Additional information displayed in hover panel
The hover panel gives additional information when the overlay is active.
Number of Units / Minute
The number of Units / Minute which flow across this road.
Speed
The average speed in km / hour which is driven on this road.
Number of lanes
The number of lanes this road consists of.
How-to's
Gallery
File:Traffic Flow-Overlay.jpg
Optional Traffic Flow overlay

