Average Overlay: Difference between revisions
No edit summary |
No edit summary |
||
| (91 intermediate revisions by 9 users not shown) | |||
| Line 1: | Line 1: | ||
[[File:Average_overlay_example.JPG|thumb|250px|left|The Average Overlay of the urbanization attribute.]] | |||
The Average Overlay is a multi purpose [[Grid overlay|Grid Overlay]] which displays (smoothed) values. These values can originate from spatial features, such as [[building]]s, [[terrain]]s, [[area]]s and [[neighborhood]]s. Alternatively, the values can originate from an other [[Grid Overlay]]. | |||
[[ | A parameter assigned to a grid-cell can be related to one or more types of features in the [[project area]]: [[Building]]s, [[Address]]es, [[Terrain]]s, [[Area]]s, [[Neighborhood]]s and [[Net Line]]s. | ||
Thirdly the Average overlay supports replacing {{nodata}} values with interpolated non {{nodata}} values using surrounding cells within a specified distance. | |||
{{clear}} | |||
==Additional information displayed in hover panel== | |||
[[File:Average_hover_panel.JPG|thumb|250px|left|The Average Overlay of the urbanization attribute and additional information in the hover panel.]] | |||
When clicking on a specific location in the map of the Average Overlay, the hover panel gives additional information over the actual value in that specific grid cell. | |||
{{clear}} | |||
== | ==Calculation== | ||
[[ | The Average Overlay works by first rasterizing input values. These values can be obtained from Vector data or a [[Grid Overlay]]. | ||
Once [[#Rasterized Vector data|rasterized]], the configured result type determines the operation applied on these values. | |||
Additional parameters determine for example the [[Distance m (Average Overlay)|range of the operation]], the [[Default value (Average Overlay)|default value]] in case none was rasterized and the [[Attribute timeframes (Average Overlay)|amount of timeframes]] that should be created when rasterizing an attribute with potentially more than one value. | |||
===Averaged Input Type=== | |||
You can also configure in what way a value for this overlay will be [[Rasterization (Average Overlay)|rasterized]]: | |||
* '''First''': Selects the first value encountered among all considered Vector data types. See [[Average Overlay#Rasterized Vector data|Rasterized Vector data]] for the order. | |||
* '''Min''': Selects the minimum value among all considered Vector data types. | |||
* '''Max''': Selects the maximum value among all considered Vector data types. | |||
* '''Single layer''': Only Vector data of the configured [[MapLink (Average Overlay)]] is rasterized. | |||
* '''Grid''': Use the values of another [[Grid Overlay]] when specified as input, instead of an [[Attribute]]. {{nodata}} values of the referenced Overlay result in {{nodata}} values in the grid. The Average Overlay will have [[timeframe]]s equal to the amount of [[timeframe]]s of the Input Overlay. In case the input Grid Overlay does not have the same grid size as the Average Overlay, the input Grid Overlay 's value grid is automatically resized. | |||
{{Overlay prequels|suppresscategory=true| | |||
{{:Input prequel (Average Overlay)}} | |||
}} | |||
===Average | ===Average Result Type=== | ||
The configured [[Result type (Average Overlay)|Average Overlay result type]] determines how a cells value is calculated. The following result types are supported for the Average Overlay: | |||
== | {{result types|suppresscategory=true|allowselflinks=true| | ||
{{:Avg result type (Average Overlay)}} | |||
{{:Min result type (Average Overlay)}} | |||
{{:Max result type (Average Overlay)}} | |||
{{:Avg interpolated result type (Average Overlay)}} | |||
}} | |||
=== | ===Rasterized Vector data=== | ||
The Vector data that is rasterized is determined by two values: the configured layer [[MapLink (Average Overlay)]] of the Average overlay and the configured [[Average Overlay#Average Type|Average Type]]. If the Average Type is set to Grid, no vector data is rasterized for this overlay. When the MapLink is set to null, and the Average Type is set to anything other than Grid, all MapLink layers are considered. When the MapLink layer is set to a specific MapLink, only that type of data is rasterized. | |||
The Average Overlay currently supports the following MapLinks (in order): [[Net Line]]s, [[Address]]es, [[Building]]s, [[Terrain]]s, [[Area]]s, [[Neighborhood]]s. | |||
{{Overlay property|suppresscategory=true| | |||
{{:Rasterization (Average Overlay)}} | |||
{{:Maplink (Average Overlay)}} | |||
}} | |||
=== | ===Calculation=== | ||
The way of averaging is defined by several [[Attribute]]s, and can most easily be set using the ''Average Overlay Wizard''. | |||
The calculation can be configured via the following attributes: | |||
{{overlay attributes|suppresscategory=true|allowselflinks=true| | |||
{{:Attribute timeframes (Average Overlay)}} | |||
{{:Default value (Average Overlay)}} | |||
{{:Distance m (Average Overlay)}} | |||
}} | |||
{{ | {{article end | ||
|notes= | |||
[[File:wateroverlay_wizard_input_overlay_step.jpg|thumb|right|Input overlay step in the [[Water Overlay]] wizard.]] | |||
* ''Input Overlays'' are overlays that can provide insight in the data used for complex Overlay models (e.g the [[Water Overlay]]). These input Overlays can be added automatically as [[Average Overlay]]s to your project by selecting them in the ''Input Overlay'' step of a Wizard. | |||
|seealso= | |||
*[[Model attributes (Average Overlay)]] | |||
*[[Attribute model (Average Overlay)]] | |||
*[[Grid model (Average Overlay)]] | |||
|howtos= | |||
* [[How to add and remove an Overlay]] | |||
* [[How to edit an overlay legend]] | |||
Average Overlay Variants: | |||
* [[How to create an Average Overlay based on another Grid Overlay]]. | |||
* [[How to fill NO_DATA values in a grid overlay by interpolation using and Average Overlay]]. | |||
* [[How to create an Average Overlay based on feature attributes]]. | |||
* [[How to configure an Average Overlay to gain insight into grid cell values]]. | |||
* [[How to smooth Grid Overlay results]] | |||
|external= | |||
* [https://www.tygron.com/en/idea/extended-combo-and-average-overlay-functionalities Extended Combo and average overlay functionalities.] | |||
}} | |||
{{AverageOverlay nav}} | |||
{{Overlay nav}} | |||
Latest revision as of 13:46, 15 March 2024
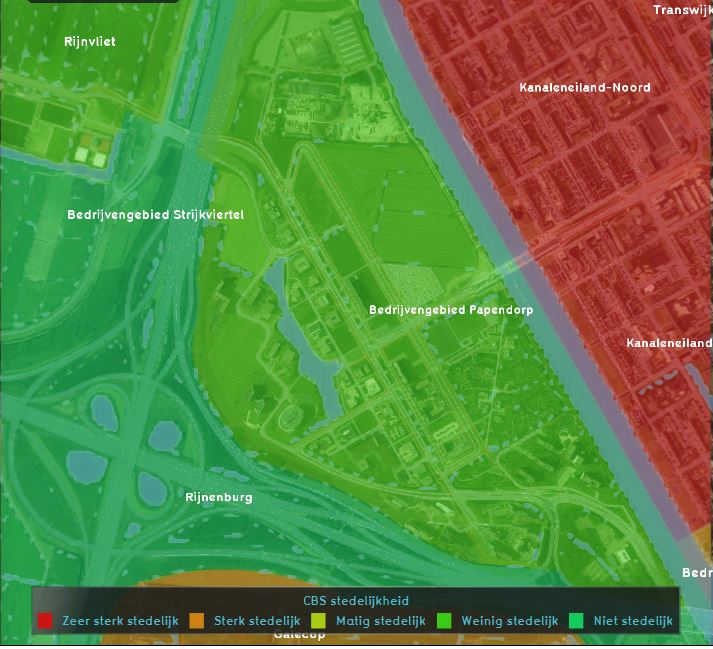
The Average Overlay is a multi purpose Grid Overlay which displays (smoothed) values. These values can originate from spatial features, such as buildings, terrains, areas and neighborhoods. Alternatively, the values can originate from an other Grid Overlay.
A parameter assigned to a grid-cell can be related to one or more types of features in the project area: Buildings, Addresses, Terrains, Areas, Neighborhoods and Net Lines.
Thirdly the Average overlay supports replacing NO_DATA values with interpolated non NO_DATA values using surrounding cells within a specified distance.
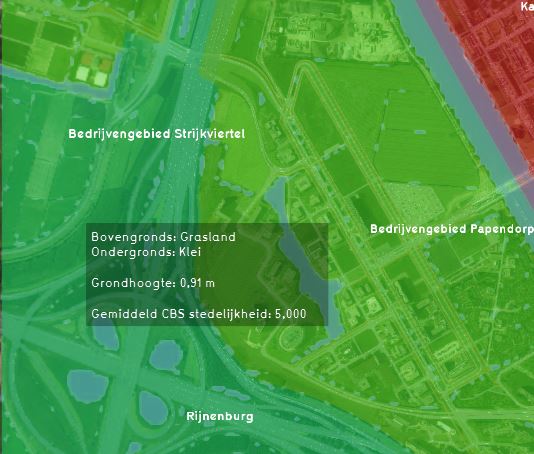
Additional information displayed in hover panel
When clicking on a specific location in the map of the Average Overlay, the hover panel gives additional information over the actual value in that specific grid cell.
Calculation
The Average Overlay works by first rasterizing input values. These values can be obtained from Vector data or a Grid Overlay.
Once rasterized, the configured result type determines the operation applied on these values.
Additional parameters determine for example the range of the operation, the default value in case none was rasterized and the amount of timeframes that should be created when rasterizing an attribute with potentially more than one value.
Averaged Input Type
You can also configure in what way a value for this overlay will be rasterized:
- First: Selects the first value encountered among all considered Vector data types. See Rasterized Vector data for the order.
- Min: Selects the minimum value among all considered Vector data types.
- Max: Selects the maximum value among all considered Vector data types.
- Single layer: Only Vector data of the configured MapLink (Average Overlay) is rasterized.
- Grid: Use the values of another Grid Overlay when specified as input, instead of an Attribute. NO_DATA values of the referenced Overlay result in NO_DATA values in the grid. The Average Overlay will have timeframes equal to the amount of timeframes of the Input Overlay. In case the input Grid Overlay does not have the same grid size as the Average Overlay, the input Grid Overlay 's value grid is automatically resized.
| Name | Prequel | Underlying data | Unit | Range | No data | Description |
|---|---|---|---|---|---|---|
| INPUT | INPUT | Average Prequel | - infinity to infinity | The Grid Overlay that provides the Average Overlay with its initial values. |
Average Result Type
The configured Average Overlay result type determines how a cells value is calculated. The following result types are supported for the Average Overlay:
| Icon | Result type | Unit | Mode | Description |
|---|---|---|---|---|
| |
AVG | A cell's value is the average of itself and its surrounding cells. | ||
| |
MIN | A cell's value is the minimum of itself and its surrounding cells. | ||
| |
MAX | A cell's value is the maximum of itself and its surrounding cells. | ||
| |
AVG_INTERPOLATED | Replace NODATA cells using its surrounding cells. |
Rasterized Vector data
The Vector data that is rasterized is determined by two values: the configured layer MapLink (Average Overlay) of the Average overlay and the configured Average Type. If the Average Type is set to Grid, no vector data is rasterized for this overlay. When the MapLink is set to null, and the Average Type is set to anything other than Grid, all MapLink layers are considered. When the MapLink layer is set to a specific MapLink, only that type of data is rasterized.
The Average Overlay currently supports the following MapLinks (in order): Net Lines, Addresses, Buildings, Terrains, Areas, Neighborhoods.
| Icon | Property | Description | Default value |
|---|---|---|---|
| |
Rasterization | The rasterization method of a Average Overlay | FIRST |
| |
Maplink | The attribute maplink (layer) used to select an Attribute when rasterizing a Average Overlay | None (null) |
Calculation
The way of averaging is defined by several Attributes, and can most easily be set using the Average Overlay Wizard.
The calculation can be configured via the following attributes:
| Icon | Attribute | Unit | Range | Description | Default value |
|---|---|---|---|---|---|
| |
ATTRIBUTE_TIMEFRAMES | integer | The amount of timeframes to display when basing input on Attribute arrays. | 1 | |
| |
DEFAULT_VALUE | The default value used for a cell when no spatial data overlaps that cell. | 0 | ||
| |
DISTANCE_M | m | 0 to 2000.0 | The radius within which an average value must be computed. | 100 |
Notes

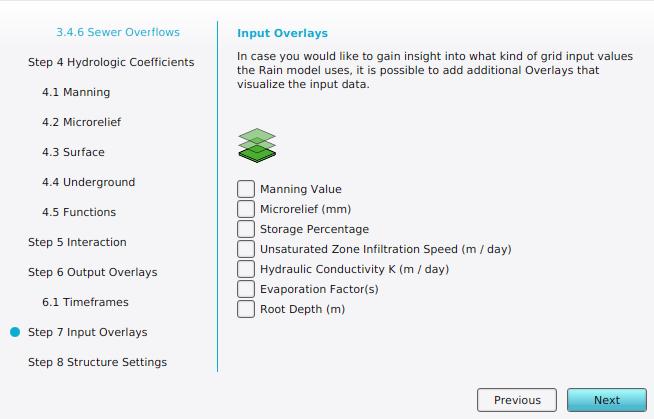
- Input Overlays are overlays that can provide insight in the data used for complex Overlay models (e.g the Water Overlay). These input Overlays can be added automatically as Average Overlays to your project by selecting them in the Input Overlay step of a Wizard.
How-to's
Average Overlay Variants:
- How to create an Average Overlay based on another Grid Overlay.
- How to fill NO_DATA values in a grid overlay by interpolation using and Average Overlay.
- How to create an Average Overlay based on feature attributes.
- How to configure an Average Overlay to gain insight into grid cell values.
- How to smooth Grid Overlay results
See also
External links

