Calculation panel
The Calculation Panel helps you to manage the calculation time of your project. The Calculation Panel can be found by hovering with your mouse over the Calculation Cloud button in the ribbon bar.

The options in this panel will allow you to set up how indicators, panels and Overlays are being (re)calculated and provide an overview of the calculation time of some of the components in your project. For more guidelines on calculation performance see Troubleshooting calculation performance.
In the top of the panel, you can find information on the total amount of grid cells in your project. This amount of grid cells relates to the Grid size and influences the performance.
Auto Update (small changes)
The Auto Update (small changes) option is by default disabled. When active it ensures that whenever you make a change in the Editor or Scenario Test run, the indicators, panels and overlays will be recalculated immediately, except for large changes which include X-queries and most model attribute's. For example switching Water Overlay from Rainfall to Groundwater requires a manual update.
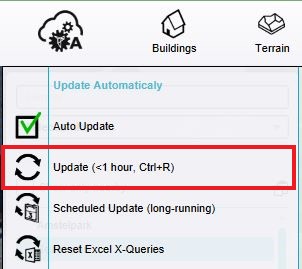
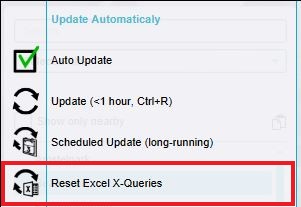
When Auto-update is disabled, you will have to manually refresh the project after making any adjustment. You can refresh the project manually by choosing one of the available options; Scheduled Update (long running), Update or Reset X-Queries. Clicking on the Auto-update button itself triggers the Update Indicators option.
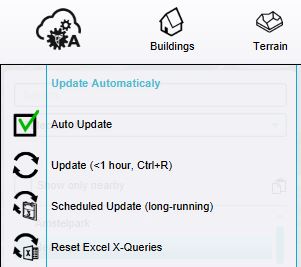
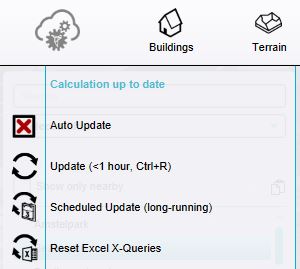
Compare the three different Project Update states below.
-
Auto update on
-
Auto update off but the project is up to date
-
Auto update is off and manual recalculation is required
Scheduled Update (long running)
Calculations are capped at a maximum calculation time of 30 minutes. This means that if a calculation takes longer than 30 minutes it reaches a "timeout" and calculates no further. This is to ensure fair use of the calculation capacity of the Tygron Platform between all customers.
When a calculation is expected to take longer than 30 minutes, it is possible to schedule a long running calculation. This means the Tygron Platform allocates specific calculation resources without a time limit, which should not hinder other calculations taking shorter amounts of time.
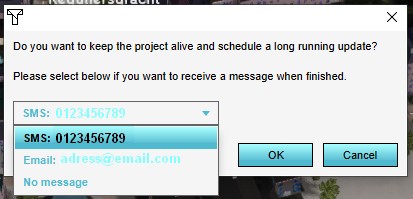
When scheduling a long running calculation, the user will be prompted whether and how to be alerted when the calculation completes. It's possible to be alerted via email, in which case an email is sent to the email address of the user, or via SMS, in which case an SMS text message will be sent to the user's registered phone number (or one entered at the time of scheduling). It is also possible to forgo an alert. In addition, opting to schedule a long running calculations will automatically put the session in Keep Alive mode. This means the Tygron Platform can be closed on the user's computer, and the Session will remain active, allowing a user to reconnect to the Session within a week.
Like with shorter calculations, if all calculation resources which allow long running calculations are already in use, the calculation remains queued until resources free up.
-
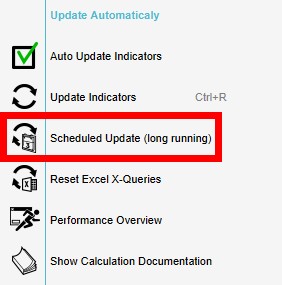
Scheduled Update (long running) option.
-
Options to be notified (or not).
Reset X-Queries
- Main article: X query (Excel)#Resetting X queries
Often, Excels for Indicators or Panels use X-Queries. These queries are interpreted by the Tygron Platform as "for every" of a certain Item. For example, {code|1=WHERE_AREA_IS_X}} will resolve to multiple queries, one for every Area. These individual queries are then reused whenever a calculation is performed.
When new Items matching the X-Query are added, or such Items are removed, it is necessary to use the "Reset X-Queries" option, to force the Tygron Platform to re-evaluate for which Items individual queries should be generated. If queries are not reset before performing a new calculation, added Items will not be included in the calculation, and removed Items will mean queries exist referencing a non-existent Item, which will result in an error.
When to choose which option?
Choose Reset Excel X-Queries if the amount of areas or neighborhoods is changed (for example by adding or removing an area/neighborhood). Choose Update Indicators if the amount of areas or neighborhoods stays the same (for example if you only changed an attribute of an area or if you did not use X-Queries in your Excelsheet.
Using any one of these option affects all indicators, panels and grid Overlays.
Simulation Core Overview
- Main article: Simulation Core Overview
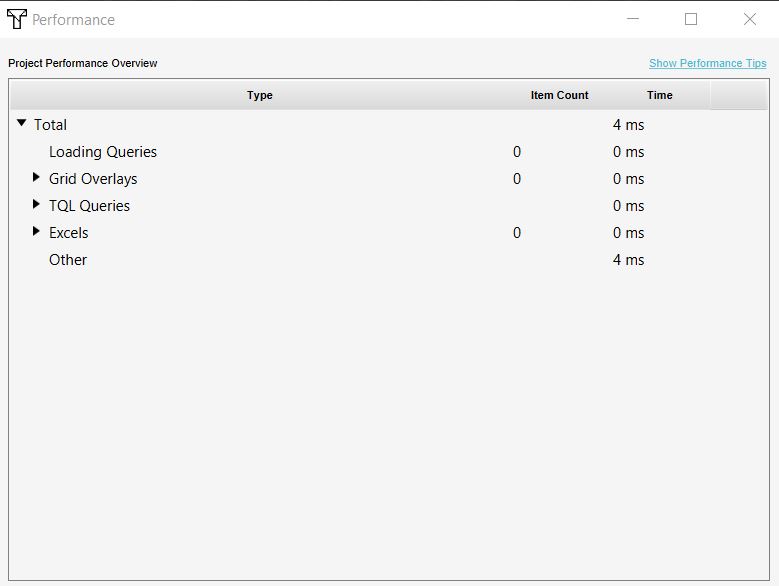
The Simulation Core Overview shows an overview of the components in a project and their calculation time. If your project performance is slow, check the overview to see which component(s) could cause this.
GPU overview
The GPU cluster overview shows the different GPU clusters that are available for calculation and their status. If they are busy with calculating components of other projects of other users, it will be visible here. Also your own calculation jobs will be visible in the panel and the possibility to cancel your own calculation(s), by clicking on the cancel icon (see image). The GPU clusters where short is stated are used for short calculations (max 30 minutes). The other GPU clusters are available for Long running scheduled calculations.
-
One of the clusters is busy with another job
-
The calculation time of one of the components in your project is visible and the option to cancel it
How-to's
- How to delay Grid Overlay calculations
- How to calculate only a part of the Project map
- How to combine multiple calculations into a single result
- How to use a limit map in a Scenario
See also
